


Are You Being Left Behind? Institutions Are Not Waiting on MSCI China A-Share Inclusion

By Luke Oliver, Head of Strategy
MSCI has not increased the inclusion factor of China A-shares in its indexes since November 2019. While the global index provider is taking a measured approach to inclusion, financial institutions are proceeding more ambitiously. In fact, international investment in China’s Mainland equity markets is outpacing MSCI inclusion, which is no small feat considering full inclusion has the potential to drive over $400 billion of new money into China’s onshore market.1 The landscape of China’s capital markets is changing and given the breadth and pace of this change, it might not be sufficient to wait on the sidelines for the next index inclusion. We believe it is time for all investors to reassess their China allocation
Money is already in motion.
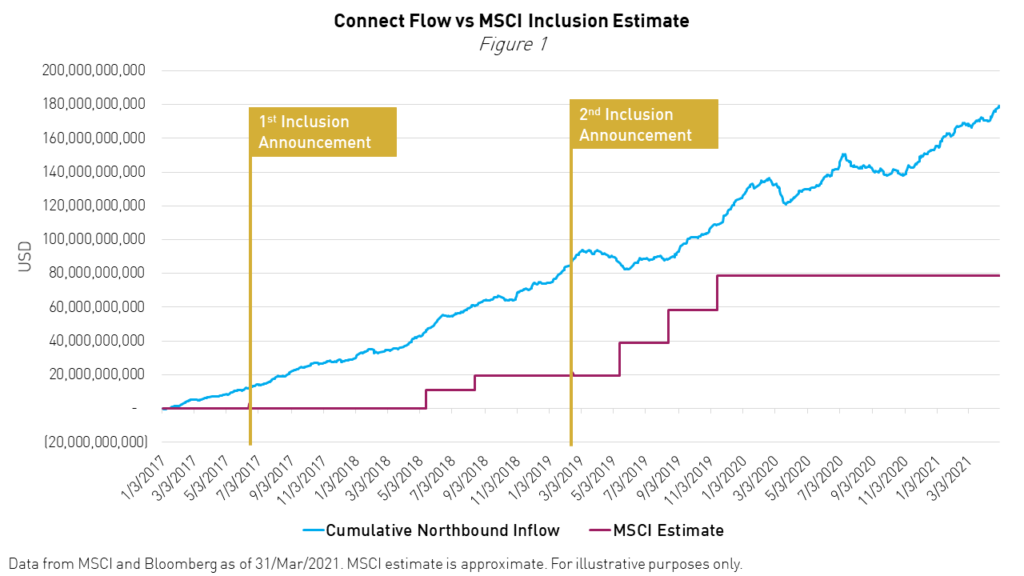
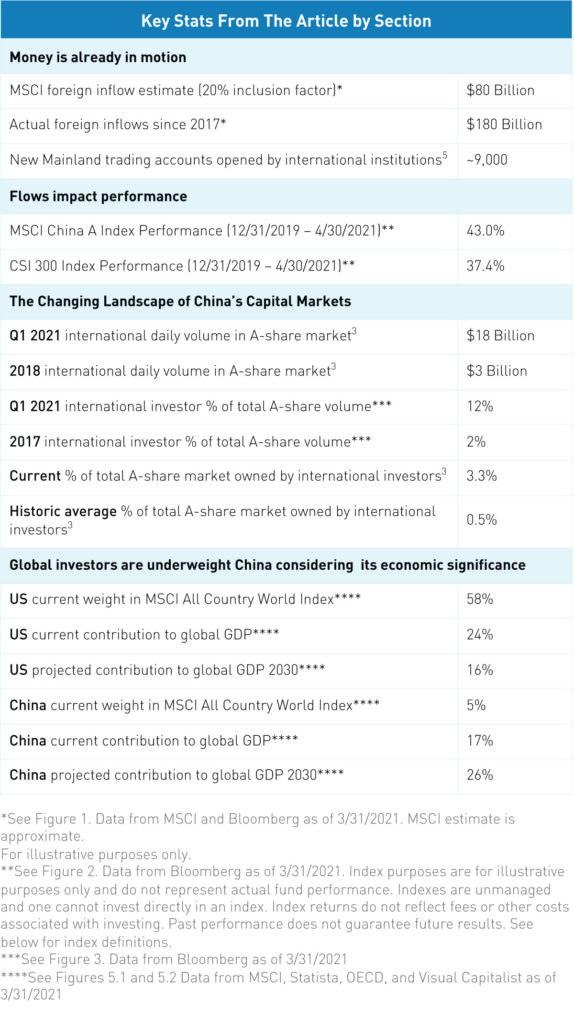
In 2018, MSCI provided a projection for the potential inflow that an initial 5% inclusion factor would generate. MSCI estimated $22 billion could flow into Mainland equities from this first step based on benchmarked assets.2 In Figure 1, we charted MSCI’s projected foreign inflows against actual foreign inflows via Northbound Hong Kong (HK) Stock Connect, which is the system that gives foreign investors access to Mainland China. Not only did the flows outpace inclusion, but they also continued to accelerate without any new announcement from MSCI.
Since the beginning of 2017, the year of the first inclusion announcement, through 30 April 2021, investors have bought $178 billion worth of China A-shares through Northbound Connect. Even though 2020 was not an inclusion year, $30 billion still moved into the Mainland. This year as of April 30, we have seen $23.5 billion in inflows, or an annualized $70.5 billion.3 Morgan Stanley & Co. recently forecasted that this annual number could top $100 billion per year for the next decade.4
That initial inclusion, albeit only 5% of the total potential future inclusion, provided a catalyst that dramatically widened the audience of market participants with access to China A-shares. International institutions have opened over 10,000 special segregated accounts (SPSAs), which are required to trade on the Shanghai and Shenzhen exchanges via Hong Kong Stock Connect. Before inclusion, only a little over 1,000 of these accounts existed.5
With increased access and forecasts that China could become the largest national economy as early as 2028,6 many global institutions have begun to reassess their exposure to China. With the growing fundamental story, historical underweights, and now increased access, it is not surprising global institutions are increasing their exposure and recognizing the China A-share opportunity beyond inclusion.
Flows impact performance.
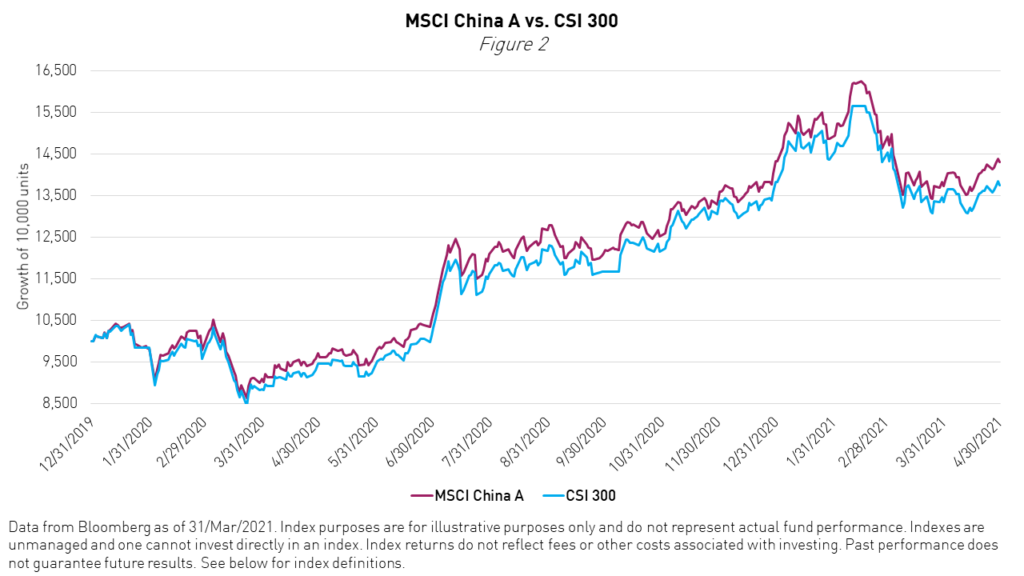
How investors implement will be important. As international flows increase, a performance disparity between the MSCI China A Index, which was designed for foreign investors, and the local CSI 300 index has emerged. Since the beginning of 2020, the MSCI China A Index has outperformed the CSI 300 Index by 561 basis points, as shown in Figure 2.
The outperformance of the MSCI index is in part driven by flows from MSCI’s clients who utilize China-specific MSCI benchmarks for their expanded investments. 99 of 100 top global asset managers are clients of MSCI, 94% of US pension assets are benchmarked to MSCI indexes, and total assets benchmarked to MSCI indexes tops $14 trillion.5 As such, there is potential for this performance disparity to continue or even accelerate as international investors allocate new money to China through an MSCI lens.
The Changing Landscape of China's Capital Markets
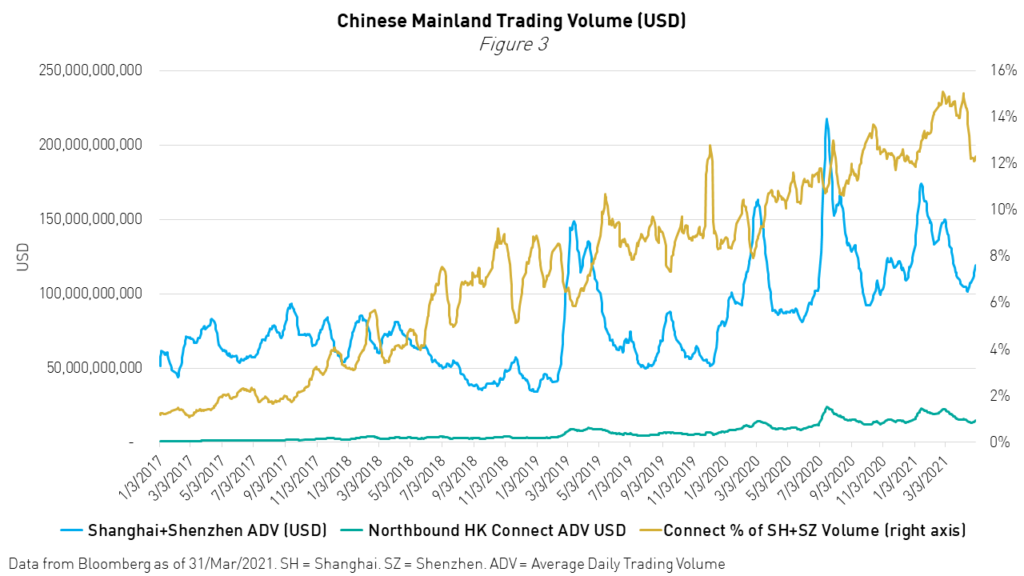
These flows are also changing the composition of China’s capital markets. The volume on the Hong Kong Northbound Connect channel is now averaging $18 billion per day as of Q1 2021, up from $11 billion this time last year and just $6.4 billion in 2019. The daily average for 2018, when the first inclusion occurred, was a mere $3 billion.3
Figure 3 shows that trading volumes both in Shanghai and Shenzhen on the Mainland as well as internationally through HK Northbound Connect have both grown steadily. However, Northbound Connect volumes have become an increasing share of total trading. Prior to inclusion, Northbound trading represented about 1% of total daily trading volume, today it averages over 11%. These statistics underscore the growing role of international investors in China’s capital markets and that the shift, which was originally thought to rely on index inclusion, is now organically happening at an accelerated pace.
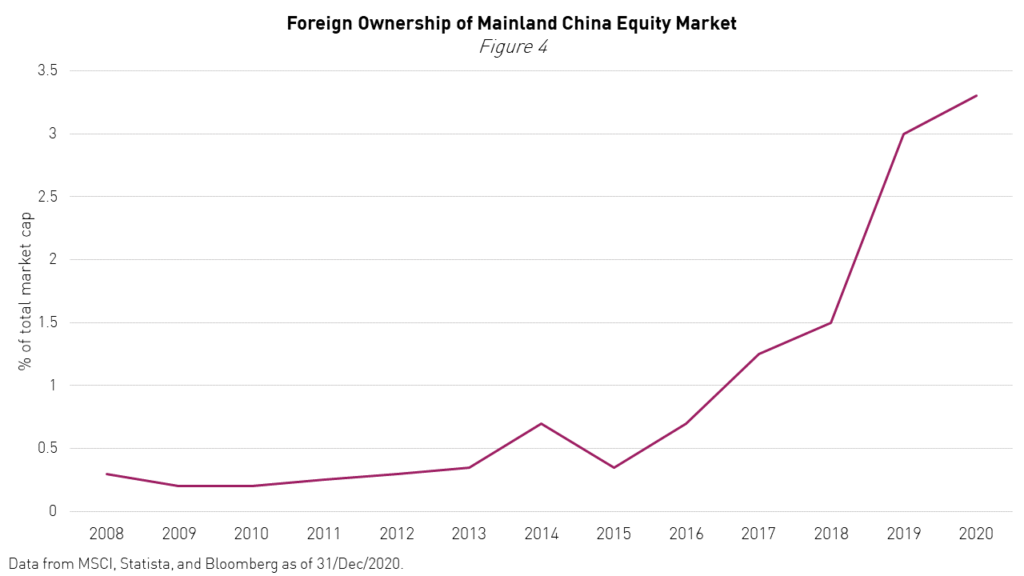
Another key indicator is moving. The growing participation of international investors is also reflected in the overall level of foreign ownership of Chinese stocks, which has historically been among the lowest globally. Figure 4 shows that foreign ownership has picked up in the last four years as access has heightened awareness of the market. Historically, foreign ownership hovered around 0.5%, over the past four years this has increased five-fold to over 3.3%, today.7 This shows that international trading is even outpacing the rapidly growing domestic market.
For comparison, 30% of Japanese stocks,8 40% of US stocks,9 and over 50% of UK stocks10 are foreign-owned. These stats highlight that there is significant scope for China’s foreign ownership to continue expanding, which could be both a short and long-term tailwind for China A-shares.
Global investors are underweight China considering its economic significance.
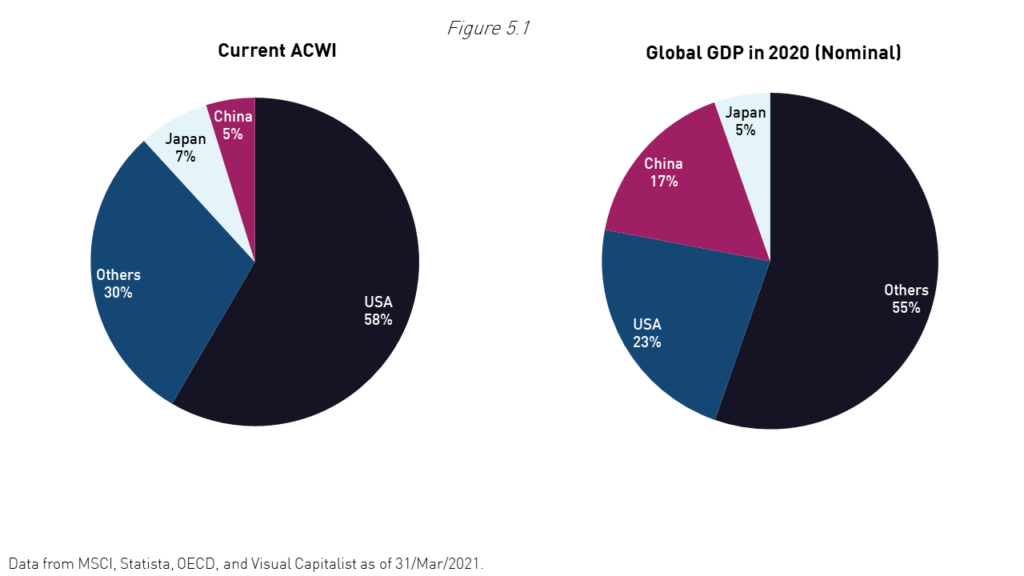
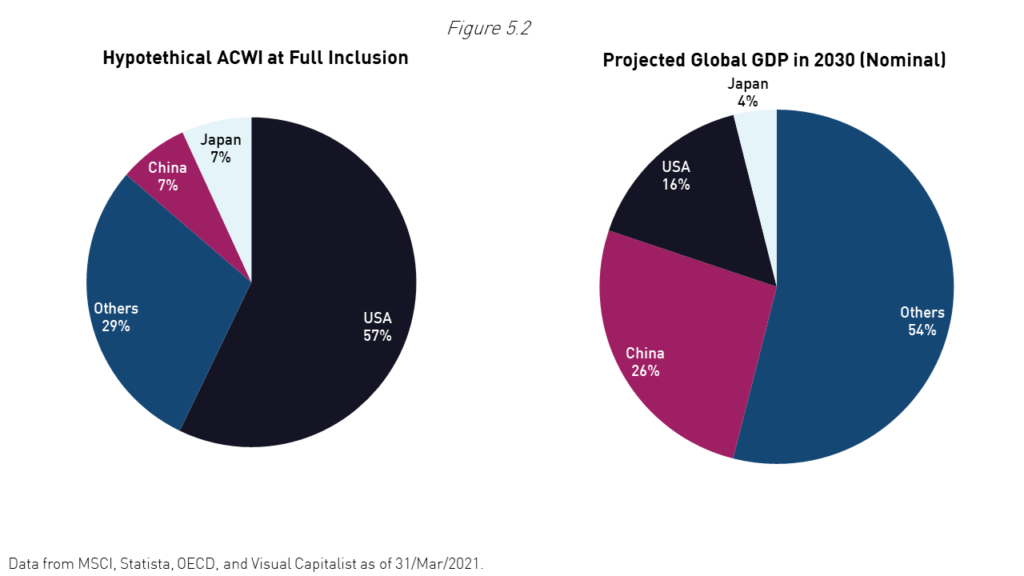
Finally, these trends are likely just the beginning. Considering China’s current and projected contribution to global GDP, we believe the shortfall in investment is glaring. In figure 5.1, we see China currently represents just 5% of the MSCI All Country World Index (ACWI) while the US represents 58%. However, China already contributes 17% of global GDP versus the US at 24%. By 2030, China is forecasted to contribute 26% of global GDP.11 The idea that the gap between market cap and economic significance should tighten, and will tighten with increased foreign investment, is at the heart of why we believe China is a substantial opportunity for investors.
While GDP contribution does not necessarily dictate the weight a given country should have in a global equity portfolio, China has considerable scope to close the gap with the US, Japan, and other major economies. We believe China A-shares, in particular, warrant a higher weight than broad benchmarks would suggest, even at full inclusion.
The Solution
The KraneShares Bosera MSCI China A Share UCITS ETF (Ticker: KBA) invests directly in China A-shares, specifically the MSCI benchmark that we believe is the driving force for international flows into the market. The steady increase in the global accessibility of China’s Mainland markets prompted us to launch KBA in 2014. KBA was the first and is the largest MSCI-linked China A-share ETF in the United States.3
Conclusion
Future-focused institutions and wealth managers are already moving ahead of the curve in deploying a dedicated China strategy and the flows and market metrics point to a growing tailwind for Mainland Chinese A-shares. We believe investors waiting on the next inclusion announcement to allocate could get left behind.
Investors seeking advice on implementing their China strategy should contact us at [email protected].
Citations
- Estimate from MSCI as of 12/May/2018, based on assets that track ACWI.
- Chia, Chin Ping. “The World Comes to China,” MSCI. May 23, 2018.
- Data from Bloomberg as of 30/April/2021.
- Morgan Stanley Equity Research.
- Data from MSCI as of 31/Dec/2020.
- “Chinese economy to overtake US ‘by 2028’ due to Covid,” BBC. December 26, 2020.
- Data from MSCI, Statista, and Bloomberg as of 31/Dec/2020.
- Data from CEIC as of 31/Mar/2017.
- Data from Tax Policy Center as of 31/Dec/2019.
- Data from Factset as of 30/Jun/2020.
- According to estimates generated by to Organization for Economic Cooperation and Development (OECD).
Index Definitions
MSCI China A Index: The MSCI China A Index captures large and mid-cap representation across China securities listed on the Shanghai and Shenzhen exchanges. The index covers only those securities that are accessible through “Stock Connect”. The index is designed for international investors and is calculated using China A Stock Connect listings based on the offshore RMB exchange rate (CNH). The index was launched on March 1, 2018.
CSI 300 Index: The CSI 300 Index consists of the 300 largest and most liquid A-share stocks. The Index aims to reflect the overall performance of the China A-share market. The index was launched on April 8, 2005.
MSCI All Country World Index (ACWI): The MSCI ACWI captures large and mid-cap representation across 23 Developed Markets (DM) and 27 Emerging Markets (EM) countries*. With 2,978 constituents, the index covers approximately 85% of the global investable equity opportunity set. The index was launched on January 1, 2001.
Term Definitions
Northbound Stock Connect: The trading program that allows foreign investors access to certain stocks listed in Mainland China through accounts in Hong Kong.
GDP (Nominal): Gross domestic product (GDP) is a measure of the total economic output in a single country, usually over the course of one year. Nominal GDP, more specifically, accounts for the measure in terms of the local currency at current exchange rates as opposed to purchasing power parity (PPP), which assumes that all currencies have equal purchasing power within their respective economies.
Northbound Connect Inflow: The net purchase of Mainland China-listed equities through the Northbound Stock Connect program.
R_EU_KS