


AI & The Dragon: What Trends Will Dominate 2024?
By Anthony Sassine, CFA, Robin Zheng, and Henry Greene
Executive Summary
- In 2023, we believe the S&P 500 Index was driven higher by AI and the "Magnificent Seven", leading to concerns about the concentration of risk in these few names and the downsizing of Emerging Markets (EM) allocations in investor portfolios.
- In 2024, EM is poised to continue its rebound due to a downward trajectory for the US dollar on the potential for Fed rate cuts or at least a plateau in rates.
- Although Taiwan, South Korea, and India performed well in 2023 due to AI-fueled semiconductor demand and a strong post-COVID economic recovery in India's case, lofty valuations in these markets may come back to earth somewhat in 2024, leading us to favor cheaper EMs such as Brazil and China.
- Focusing on long-term trends and maintaining a strategic allocation strategy, we remain cautiously optimistic about China's recovery in 2024 and beyond, and believe that current equity valuations in China do not accurately reflect fundamentals.
Introduction
2023 defied most expectations and extended already existing global equity market imbalances. It was a year of higher US rates and US Dollar, uncertain inflation, emerging artificial intelligence technologies, an expanding energy transition, and the stabilization of China. Against most odds and a harsh macroeconomic backdrop, the US economy continued to show resilience with jobs and consumption, leading to record valuations for equities in both absolute terms and relative to emerging markets.
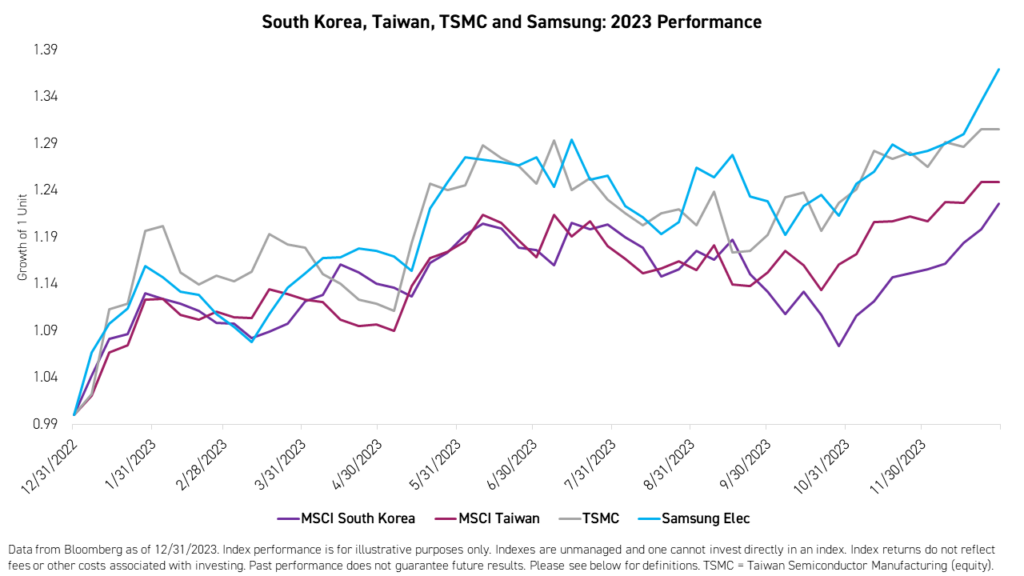
2023 started with significant optimism regarding the reopening of China. However, the shocks of the past few years, including COVID, regulations, and real estate, proved to be harder to overcome, at least from a consumer perspective. Despite it all, the Chinese economy continued to recover, albeit unevenly. The Chinese government renewed its commitment to 5% GDP growth through continued stimulus and growth-oriented policies. Meanwhile, emerging markets ex-China benefited from the emerging artificial intelligence (AI) craze following the launch of ChatGPT, Ernie Bot, and other Large Language Models (LLMs), despite traditional semiconductors experiencing a major downcycle and high inventories. Companies such as Taiwan Semiconductor and Samsung Electronics were performance leaders1.
Somehow, the beginning of 2024 feels eerily similar to the start of the previous year. We continue to believe that emerging markets are extremely cheap (especially China) compared to the US and have better growth potential. We continue to believe that US equities and the US Dollar are over-extended. We also believe that inflation is declining, and interest rates are at damaging levels. Predicting when the tide will shift is hard to do. The US Fed panicking, this time to the downside, may be a good signal.
In the face of it all, our approach remains the same: Focus on the long term with a balanced strategic allocation to various global equity markets. We still believe that an allocation to EM is better expressed by treating China as an asset class and focusing on the next-generation growth sectors, including internet, clean technology, consumer, luxury, 5G, and more. This approach becomes even more relevant as imbalances grow and the probability of mean reversion increases.
2023 Emerging Markets (EM) Performance Review
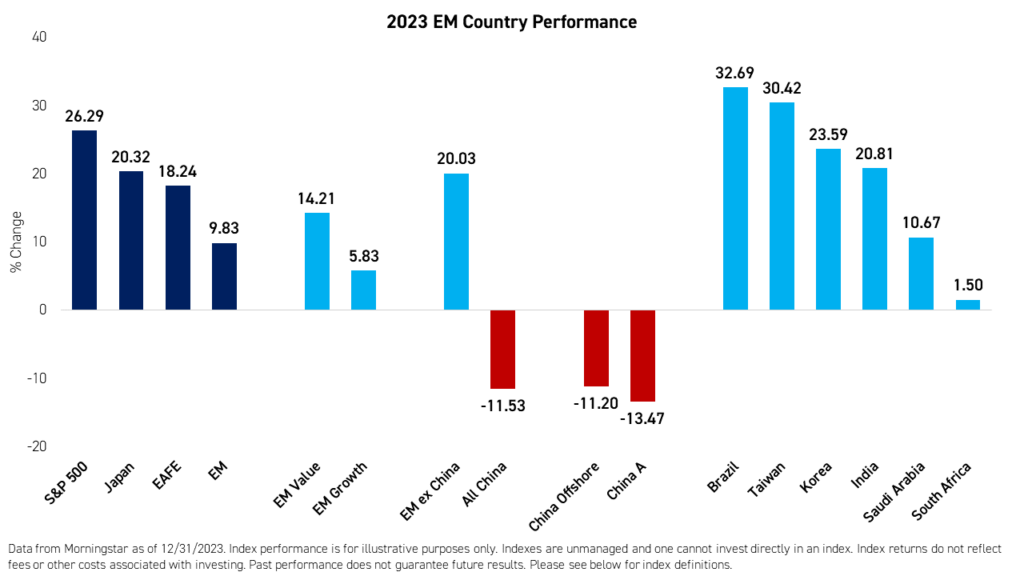
It was a tale of two EMs in 2023 with EM ex-China returning 20.03%1 and China All Shares declining -11.53%1. MSCI EM ended the year by rising 9.83%1, underperforming the S&P 500, which returned an impressive 26.29%1, and MSCI EAFE, which returned 18.24%1. EM Value prevailed in 2023, rising 14.21%1 versus 5.83%1 for EM Growth. MSCI EM ex China’s performance was driven by strong performance in Brazil, Taiwan, and Korea, whereas MSCI China, which consists of mostly offshore stocks, declined 11.20%1 and MSCI China A Onshore declined -13.47%1. Technology-related stocks performed best in 2023, as Samsung Electronics and Taiwan Semiconductor Manufacturing Company (TSMC), the two largest companies in MSCI EM, rose 44.90%1 and 34.98%1 respectively. India was also a standout in 2023, completing another positive year.
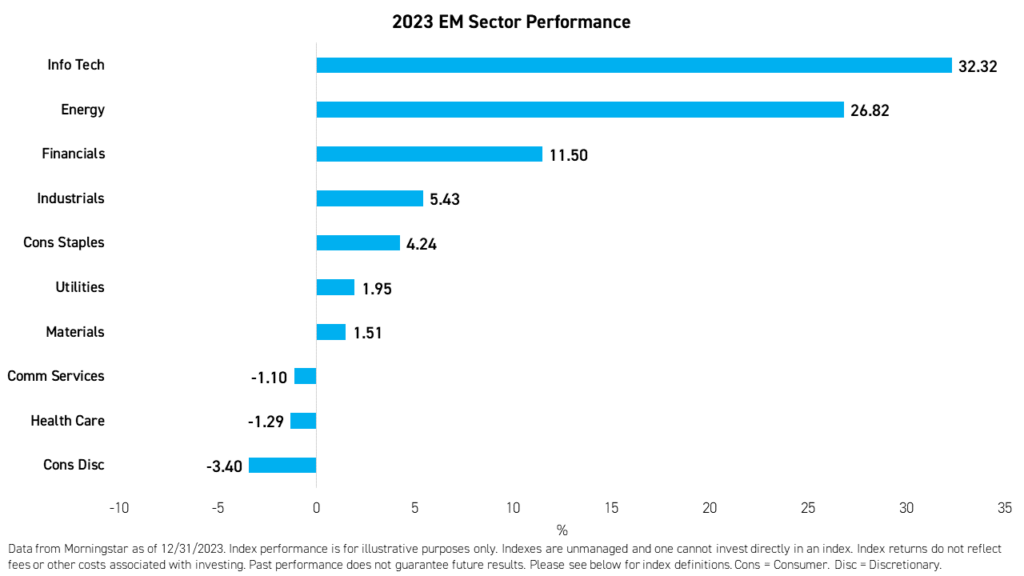
On a sector level, information technology, and energy were the two best-performing sectors in 2023, while consumer discretionary, health care and communication services continued to drag.
Global Macroeconomic Outlook
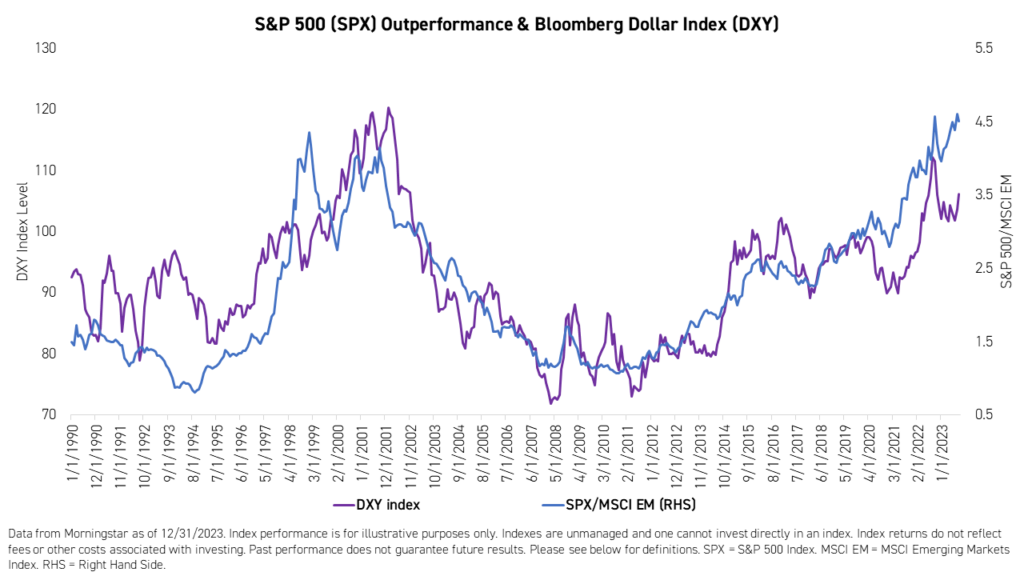
Inflation was the main unknown in 2023 that continued to influence interest rate expectations and markets. It was not until the end of October that investors received confirmation from the US Fed that it had reached the top of its hiking cycle. The new interpretation of the US Fed's potential future actions sent the S&P 500 on a nearly 15%1 year-end rally. 10-year rates declined from 5% to below 4%1 before rising slightly again. The US Dollar, on the other hand, lost some of its luster towards the end of the year, but still ended 2023 ahead of most currencies including China’s Renminbi and those of other major EMs.
We believe uncertainty around rates and inflation will continue to influence markets in 2024, but less so than in 2023. There is a possibility that we may witness another US Fed panic attack, this time on the downside, if US growth prospects deteriorate quickly. Unemployment, housing, and consumption have held up admirably so far despite multi-decade high rates. It remains uncertain at what point the current macroeconomic environment will impact demand materially and lead companies to lay off workers and cut spending. Either way, with the market starting to price in rate cuts in 2024 and lower growth rates, we believe the US Dollar may be at the beginning of a downward trend.
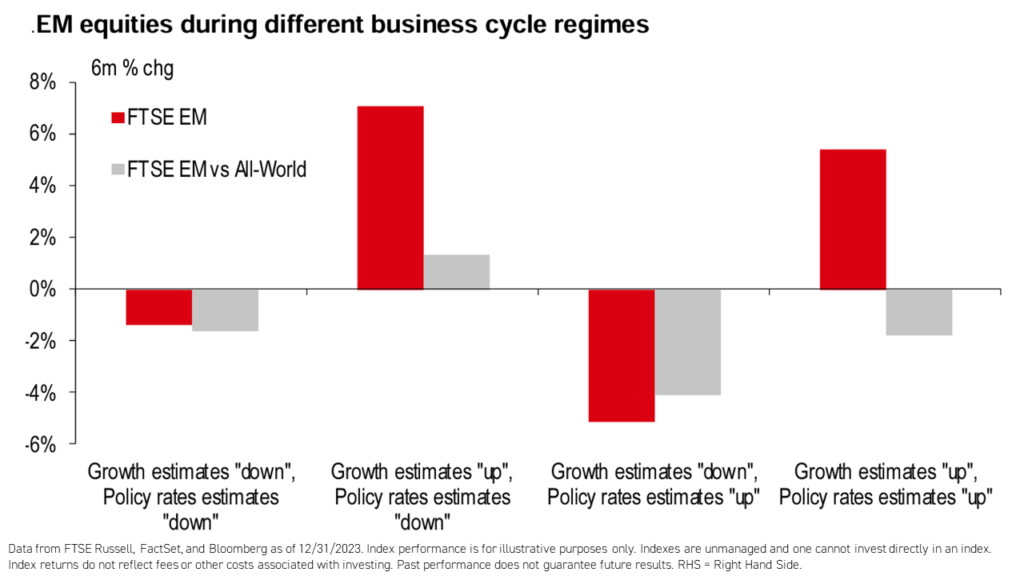
Emerging markets, on the other hand, seem to be turning a corner as we are starting to see growth estimates ticking higher and policy rates expectations sliding lower. EM traditionally has done well in such a regime2.
China Outlook
In 2023, China continued to adjust to a post-COVID and regulation era. However, the shocks proved difficult, especially for homeowners and China’s youth and new graduates. The government’s growth-oriented policies and stimulus were most helpful for supply-side industries like manufacturing and infrastructure. Still, they failed to revive consumer sentiment and demand, despite the government recognizing the weakness in consumption and private investment as recently as December. We believe the policies in 2024 will be geared towards consumption, real estate, and the revival of private companies, especially the internet, green, and technology economies.
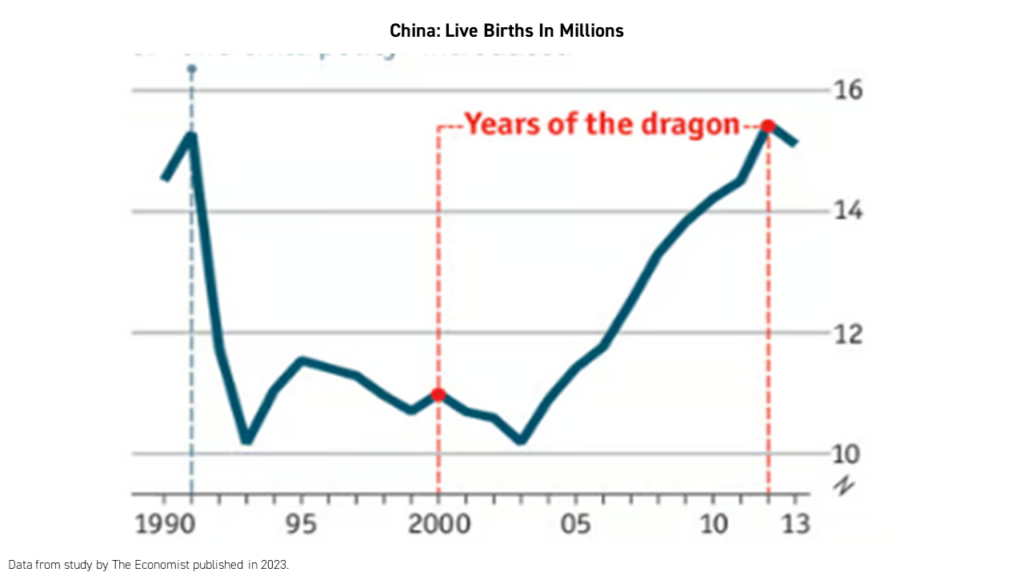
2024 is the year of the Dragon in China, traditionally a year of good fortune and evolution. People born during this year are believed to have highly desirable personality traits. Some of the most famous people born during the Year of the Dragon include Jack Ma, Li Ka Shing, and Bruce Lee3. Will the Year of the Dragon help unlock optimism among consumers? Historically, childbirth has been highest during the years of the dragon. We believe sentiment improvement will be key. It will happen gradually as the economy continues to recover and people adjust. We believe government policy can also help accelerate the process.
Fundamentals hint at potential attractive entry point.
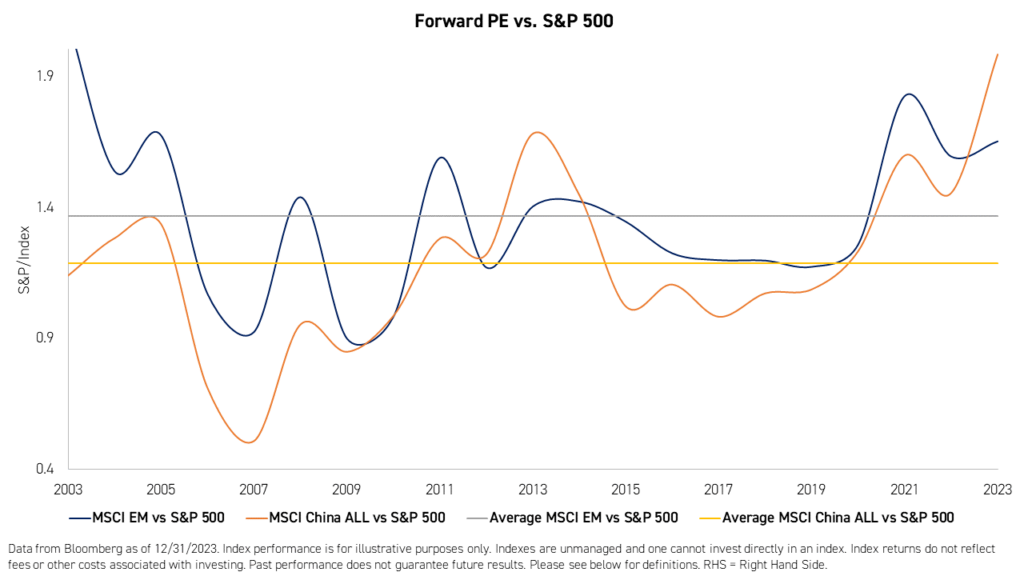
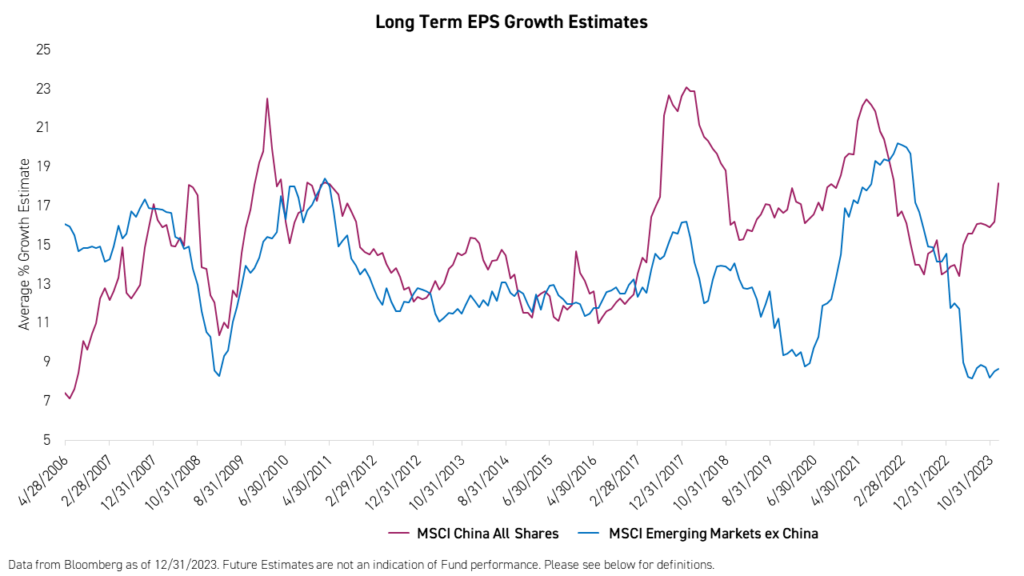
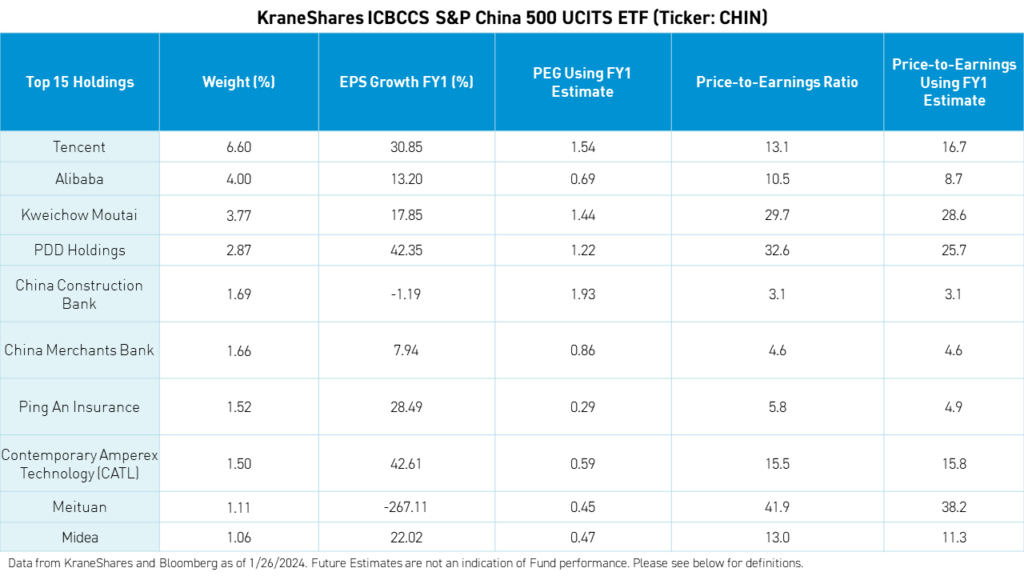
Given the significant dislocation between the markets and the actual economy, we believe the entry point to China is highly attractive. There is a consensus among investors that China's valuations are at a multi-year low, especially compared to US equities and EM ex-China. Furthermore, analysts expect double-digit growth (16.7%)1 for EPS in 2024.
While companies' sales growth forecast is lower than the usual long-term average for Chinese companies, EPS growth is expected to be significant1. Most companies in China, especially internet companies, have been focused on optimization and cost efficiency. We believe the discipline learned over the past two years is now paying dividends in terms of higher margins and earnings growth.
Consumer confidence and real estate sales are at lows with a strong potential for recovery.
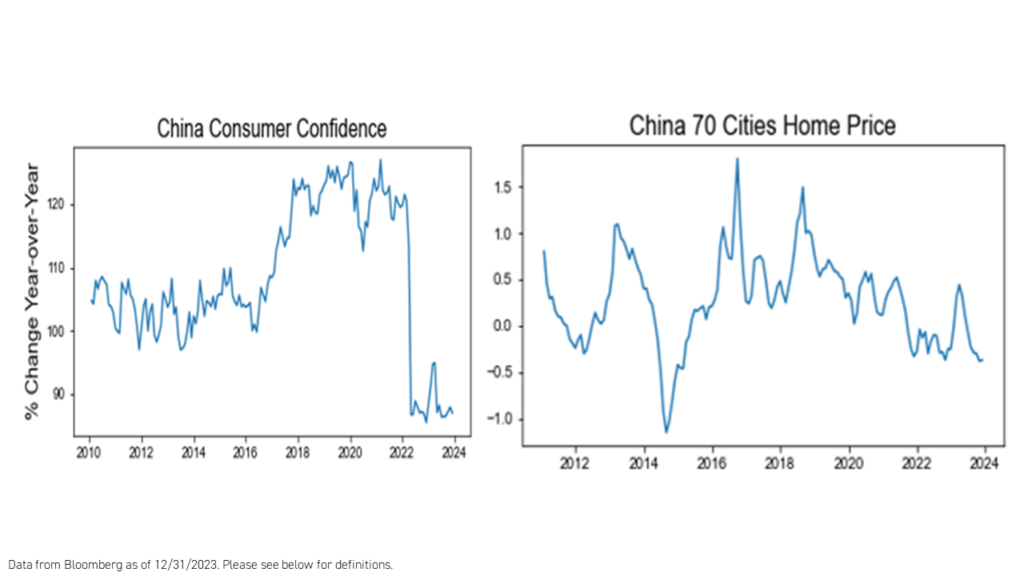
China’s underperformance has not been due to long-term structural issues but rather a short-term economic dislocation resulting from China’s recent economic shocks, which caused the growth train to veer off track. Once corrected, we believe China's performance will begin to reflect its long-term potential. One of the main drags on China’s growth has been the lack of spending by the Chinese consumer and the lack of hiring and investing on the part of China’s private companies. Consumer sentiment remains at a multi-year low mainly due to real estate and the rise in youth unemployment. Recent consumer surveys show that sentiment regarding jobs, wages, and inflation is improving5. Also, the outlook for real estate seems to be stabilizing after a tough year. The loosening of second home mortgages along with help for developers and developments has started to gradually bring back buyers. We believe consumer sentiment and real estate will be on a recovery path in 2024.
Government policy remains cautiously accommodative of growth.
There was no stimulus Bazooka in 2023 as many investors had hoped. China continued to perform targeted stimulus for essential industries such as real estate, manufacturing, and infrastructure. The stimulus has been instrumental in keeping growth on target. However, the plan has failed to revive consumption to pre-COVID growth levels. We believe China requires some demand-side stimulus that focuses on strengthening the safety net for the Chinese people and providing jobs to new graduates. The recovery of consumption could be the last piece of China’s growth puzzle. Any improvement in consumer sentiments could indicate the recovery moving into second gear. The government has started to roll out creative programs such as cheap or subsidized housing, which helps in the transfer of economic gains from industry to the consumers. We believe we may see more of such policies in 2024 in addition to continued fiscal and monetary support in the form of infrastructure spending and rate cuts.
Emerging Markets ex China Outlook
The emergence of ChatGPT towards the end of 2022, worked well for EM ex-China in 2023. It was supposed to be a year of adjustment and lower growth as the region battled with higher inflation and rates, slower global growth, and a glut of semiconductor chips due to high inventories. Artificial intelligence changed EM ex China’s trajectory.
Taiwan was a winner from the AI craze in 2023 returning 28%1 despite a forecasted -22%3 contraction in EPS for the same year. Growth is expected to rebound in 2024 for Taiwan mainly driven by the recovery in traditional semiconductor ship and technology cycle and also declining rates in the US. However, Taiwan remains in the crosshair of the geopolitical storm between the US and China. Last year, China banned multiple agricultural products from various countries. Although Taiwan’s agriculture exports to China are minimal, any ban on bigger export industries like petrochemicals or machinery could be damaging to Taiwanese firms. Furthermore, the technology war waged by the US on China has disrupted the global semiconductor industry, in which Taiwan is a major player.
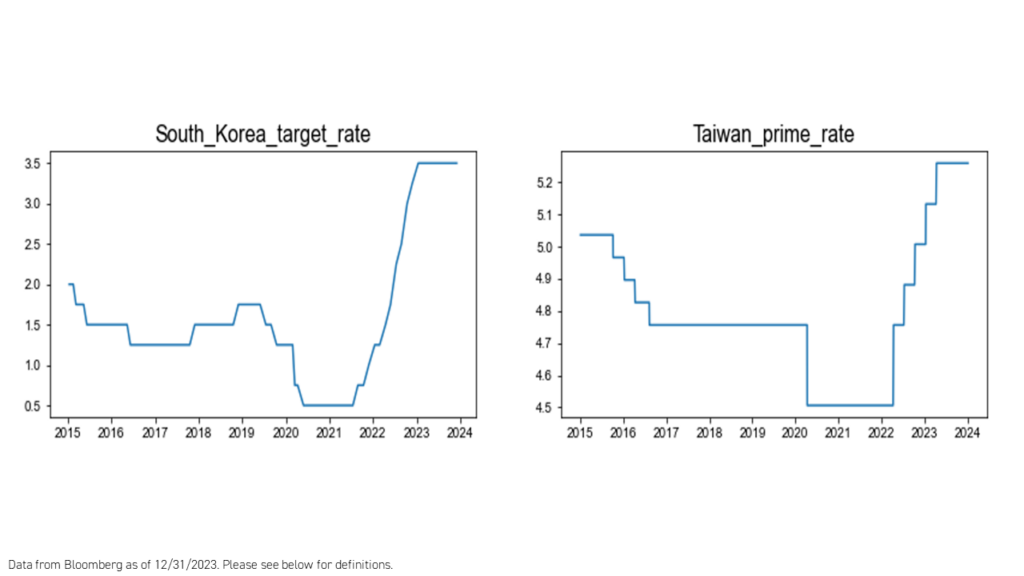
Korea was another winner of the AI craze with Samsung Electronics leading the charge. Similar to Taiwan, higher US inflation and rates impacted Korea, and 2023 was supposed to be a down year as reflected in the 40%1 plus expected decline in 2023 EPS. With the memory and NAND chip prices recovering from a multi-year slump, the outlook for Korea's EPS growth outlook flipped to an expected 60% for 2024. Monetary policy may be restrictive for longer. The Bank of Korea has been conservative in raising rates last year and will probably have a similar stance on rate cuts as inflation declines.
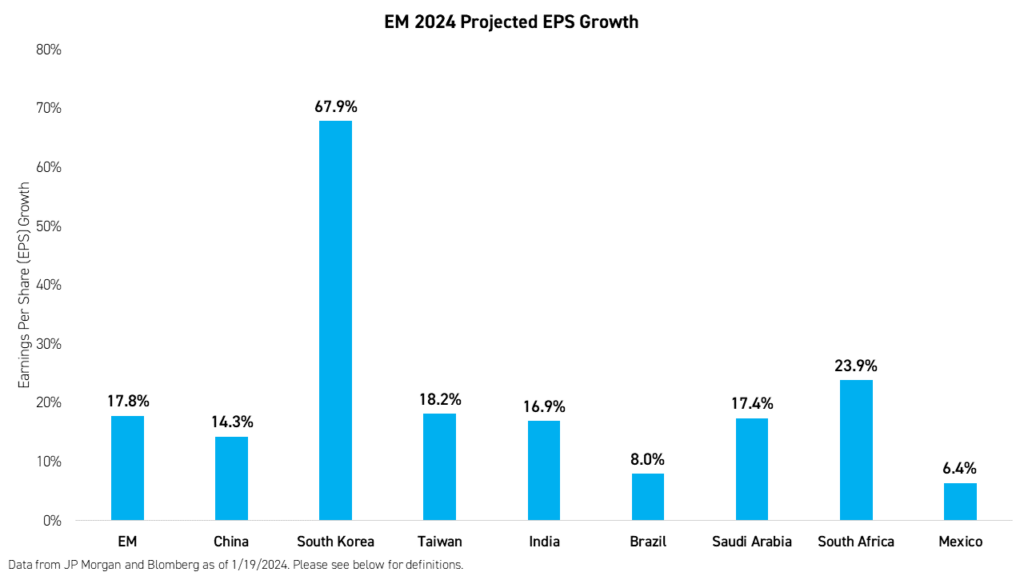
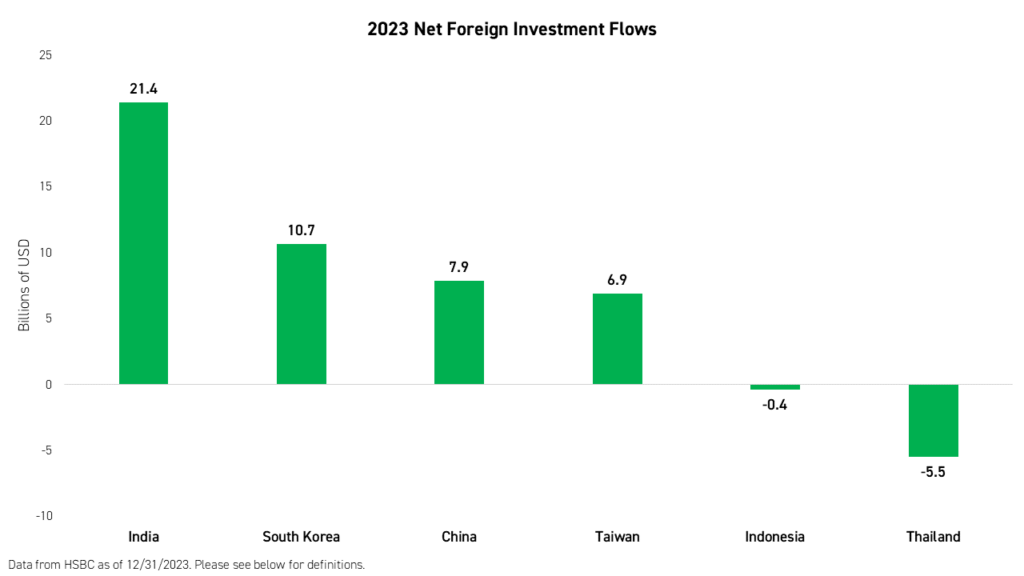
India scored another impressive year for the books, gaining 20.81% in 2023. The economic momentum is real and is capturing global investors' attention. Despite a hefty valuation compared to its history and other EMs, India captured the lion's share of the foreign investors’ flows. They invested more than $20 billion in 2023. Korea came in second at $10 billion. India's earnings growth expectations continue to be impressive at 16.9% in 2024 and the macro environment seems favorable as GDP growth is expected to be 6 to 6.5% as inflation continues to fall below 5%. The two main risks for India next year are high valuation (which investors seem to be willing to ignore for now) and elections. The market is hoping the incumbent government will win. Polls currently seem to be favoring Modi for a 3rd term.
Brazil had a good year as well returning 32.69% in 2023. Despite the rally, Brazil's valuations remain low, and real rates are expected to continue to decline to the 8% level. If commodities are to rebound in 2024 and oil prices continue to sell at a premium due to uncertainties, these are more reasons to be constructive on Brazil equities for 2024. Petrobras production estimates were revised higher in 2024. Consumer-related sectors are expected to benefit from lower rates and food inflation.
Conclusion
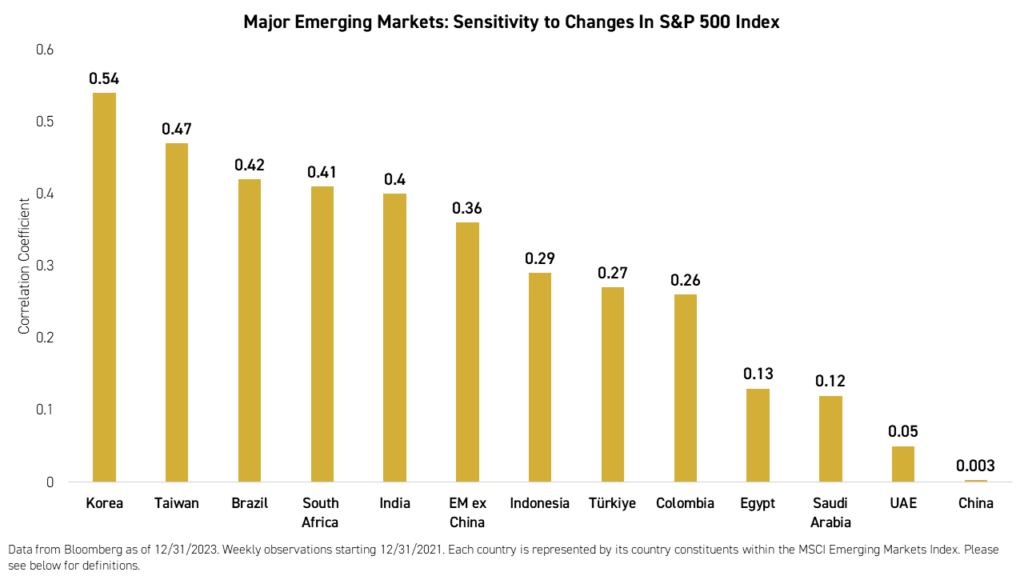
With the S&P 500 Index being mostly driven by the "Magnificent Seven", we are concerned about the concentration of risk in these few names. Emerging markets allocations have dropped significantly in investors' portfolios due to the impressive performance of the S&P or the negative headlines related to China. That, in our opinion, presents a risk for US investors especially when the tide turns, and it will. There are many good reasons for EM to outperform the US and developed markets over the next investment cycle including rebounding growth, lower valuations, lower positioning, extended US equities, US rates, and US Dollars. Emerging markets, when approached as China and EM ex-China, can help diversify* portfolios and provide an upside potential when the dust settles. China, out of all major EM countries, has exhibited a near zero sensitivity to the US market since 2021. We believe EM is much cheaper than the US, and within EM, we believe China to be at historic valuation and positioning lows, presenting investors with potentially the best entry point in over a decade.
*Diversification does not ensure a profit or guarantee against a loss.
For CHIN top 10 holdings, risks, and other fund information, please click here.
This is a marketing communication. Please refer to the prospectus of the UCITS, the KIID, and the PRIIPs.
This material is for educational purposes. Although this material may discuss KraneShares' US Funds, it should not be regarded as a marketing communication or recommendation for such Funds as they are only available through US markets.
Citations:
- Data from Bloomberg as of 31/Dec/2023.
- Data from HSBC Research as of 31/Dec/2023.
- Blackwing News. "Dragon: The Life & Legacy of Bruce Lee - Part I," Blackwing. Accesses 22/Jan/2024.
Index & Term Definitions:
MSCI Emerging Markets Index: The MSCI Emerging Markets Index is a free-float weighted equity index that captures large and mid cap representation across Emerging Market (EM) countries. The index covers approximately 85% of the free-float adjusted market capitalization in each country. The index was launched on 1 January, 2001.
MSCI China All Shares Index: The MSCI China All Shares Index captures large and mid-cap representation across China A‐shares, B‐shares, H‐shares, Red‐chips, P‐ chips and foreign listings (e.g. ADRs). The index aims to reflect the opportunity set of China share classes listed in Hong Kong, Shanghai, Shenzhen and outside of China. It is based on the concept of the integrated MSCI China equity universe with China A-shares included. The index was launched on 26 June, 2014.
MSCI Emerging Markets ex China Index ("EM ex China"): The MSCI Emerging Markets ex China Index captures large and mid cap representation across 26 of the 27 Emerging Markets (EM) countries excluding China. With 678 constituents, the index covers approximately 85% of the free float-adjusted market capitalization in each country. The index was launched on 9 March, 2017.
MSCI China A Index ("China A"): The MSCI China A Index captures large and mid-cap representation across China securities listed on the Shanghai and Shenzhen exchanges. The index covers only those securities that are accessible through "Stock Connect". The index is designed for international investors and is calculated using China A Stock Connect listings based on the offshore RMB exchange rate (CNH).
MSCI Taiwan Index ("Taiwan"): The MSCI Taiwan Index is designed to measure the performance of the large and mid cap segments of the Taiwan market. With 90 constituents, the index covers approximately 85% of the free float-adjusted market capitalization in Taiwan. The index was launched on 31 July, 1989.
MSCI Brazil Index (“Brazil”): The MSCI Brazil Index is designed to measure the performance of the large and mid cap segments of the Brazilian market. With 47 constituents, the index covers about 85% of the Brazilian equity universe. The index was launched on 1 January, 2001.
MSCI India Index (“India”): The MSCI India Index is designed to measure the performance of the large and mid-cap segments of the Indian market. With 115 constituents, the index covers approximately 85% of the Indian equity universe. The index was launched on 30 April, 1992.
MSCI Korea Index (“Korea”): The MSCI Korea Index is designed to measure the performance of the large and mid cap segments of the South Korean market. With 102 constituents, the index covers about 85% of the Korean equity universe. The index was launched on 1 January, 2001.
MSCI Emerging Markets Energy Sector Index (“Energy”): The MSCI EM Energy Sector Index is a free-float weighted equity index. It was developed with a base value of 100 as of 31 December, 1998. The parent index is the MSCI Emerging Markets Index.
MSCI Emerging Markets Information Technology Index (“Information Technology”): The MSCI Emerging Markets Information Technology Index is designed to capture the large and mid-cap segments across 24 Emerging Markets (EM) countries*. All securities in the index are classified in the Information Technology sector according to the Global Industry Classification Standard (GICS®).
MSCI Emerging Markets Financials Index (“Financials”): The MSCI Emerging Markets Financials Index captures large and mid cap representation across 24 Emerging Markets (EM) countries*. All securities in the index are classified in the Financials sector as per the Global Industry Classification Standard (GICS®). The index was launched on 1 January, 2001.
MSCI Emerging Markets Communication Services Index (“Communication Services”): The MSCI Emerging Markets Communication Services Net Total Return USD Index is a free-float weighted equity index. The parent index is the MSCI Emerging Markets Index. It is a GICS level 1 Index.
MSCI Emerging Markets Industrials Index (“Industrials”): The MSCI EM Industrials Index is a free-float weighted equity index. It was developed with a base value of 100 as of 1 December, 1998. The parent index is the MSCI Emerging Markets Index.
MSCI Emerging Markets Consumer Discretionary Index (“Consumer Discretionary”): The index is designed to measure the combined equity market performance of the consumer discretionary sector of emerging markets countries. The index was launched on 1 January, 2001.
MSCI Emerging Markets Materials Index ("Materials"): The MSCI Emerging Markets Materials Index captures large and mid cap representation across 24 Emerging Markets (EM) countries*. All securities in the index are classified in the Materials sector as per the Global Industry Classification Standard (GICS®). The index was launched on 15 September, 1999.
MSCI Emerging Markets Health Care Index (“Health Care”): The MSCI Emerging Markets Health Care Index is designed to capture the large and mid cap segments across 24 Emerging Markets (EM) countries* around the world. All securities in the index are classified in the Health Care sector as per the Global Industry Classification Standard (GICS®).
MSCI Emerging Markets Utilities Sector Index (“Utilities”): The EM Utilities Sector Index is a free-float weighted equity index. It was developed with a base value of 100 as of 31 December, 1998. The parent index is the MSCI Emerging Markets Index.
MSCI Emerging Markets Consumer Staples Index ("Consumer Staples"): The MSCI Emerging Markets Consumer Staples Index captures large and mid cap representation across 24 Emerging Markets countries. All securities in the index are classified in the Consumer Staples sector as per the Global Industry Classification Standard (GICS). The index was launched on 15 September, 1999.
S&P 500 Index: The S&P 500 Index is widely regarded as the best single gauge of large-cap U.S. equities. There is over USD 9.9 trillion indexed or benchmarked to the index, with indexed assets comprising approximately USD 3.4 trillion of this total. The index includes 500 leading companies and covers approximately 80% of available market capitalization. The index was launched on 4 March, 1957.
Bloomberg Dollar Spot Index ("DXY Index"): The Bloomberg Dollar Spot Index tracks the performance of a basket of ten leading global currencies versus the U.S. Dollar. Each currency in the basket and its weight is determined annually based on their share of international trade and FX liquidity. The index data starts from 31 December, 2005 with a base level of 1000.
Consumer Confidence Index The index aids in measuring consumer sentiments in personal finances, business conditions, among other topics. Historically, the index displays pessimism in consumers' confidence during recessionary periods, and increased consumer confidence in expansionary periods.
Loan Prime Rate (LPR): The rate that commercial banks charge their most creditworthy corporate customers.
Gross Domestic Product (GDP): Gross domestic product (GDP) is the total monetary or market value of all the finished goods and services produced within a country’s borders in a specific time period.
MSCI China Index ("Offshore China"): The MSCI China Index captures large and mid-cap representation across China A shares, H shares, B shares, Red chips, P chips and foreign listings (e.g. ADRs). With 703 constituents, the index covers about 85% of this China equity universe. Currently, the index includes Large Cap A and Mid-Cap A-shares represented at 20% of their free float adjusted market capitalization. The index was launched on 31 October, 1995.
MSCI EAFE Index (“EAFE”): The MSCI EAFE Index is an equity index which captures large and mid cap representation across Australia, Austria, Belgium, Denmark, Finland, France, Germany, Hong Kong, Ireland, Israel, Italy, Japan, the Netherlands, New Zealand, Norway, Portugal, Singapore, Spain, Sweden, Switzerland, and the UK. With 825 constituents, the index covers approximately 85% of the free float-adjusted market capitalization in each country. The index was launched on 31 March, 1986.
MSCI Japan Index ("Japan"): The MSCI Japan Index is designed to measure the performance of the large and mid cap segments of the Japanese equity market. With 225 constituents, the index covers approximately 85% of the free float-adjusted market capitalization in Japan. The index was launched on 31 March, 1986.
MSCI Emerging Markets Value Index: The MSCI Emerging Markets Value Index captures large and mid cap securities exhibiting overall value style characteristics across 24 emerging markets countries. The value investment style characteristics for index construction are defined using three variables: price-to-book, 12-month forward price-to-earnings, and dividend yield. The index was launched on 8 December, 1997.
Dividend Yield: The dividend yield, expressed as a percentage, is a financial ratio (dividend/price) that shows how much a company pays out in dividends each year relative to its stock price.
MSCI Emerging Markets Growth Index: The MSCI Emerging Markets Growth Index captures large and mid cap securities exhibiting overall growth style characteristics across 24 emerging markets countries. The growth investment style characteristics for index construction are defined using five variables: long-term forward earnings per share (EPS) growth, short-term forward EPS growth, current internal growth rate, and long-term historical EPS growth trend, and long-term historical sales per share growth trend. The index was launched on 8 December, 1997.
MSCI Saudi Arabia Index ("Saudi Arabia"): The MSCI Saudi Arabia Index is designed to measure the large and mid cap segments of the Saudi Arabia equity market. The index incorporates foreign ownership limit restrictions and, with 42 constituents, the index covers approximately 85% of the free float-adjusted market capitalization in Saudi Arabia. The index was launched on 8 October, 2014.
MSCI South Africa Index ("South Africa"): The MSCI South Africa Index designed to measure the performance of the large and mid cap segments of the South African market. With 32 constituents, the index covers approximately 85% of the free float-adjusted market capitalization in South Africa. The index was launched on 1 January, 2001.
MSCI Emerging Markets Health Care Index ("Health Care"): The MSCI Emerging Markets Health Care Index is designed to capture the large and mid cap segments across 24 Emerging Markets (EM) countries* around the world. All securities in the index are classified in the Health Care sector as per the Global Industry Classification Standard (GICS). The index was launched on 1 January, 2001.
Price-to-Earnings (P/E) Ratio: The price-to-earnings ratio is the ratio for valuing a company that measures its current share price relative to its earnings per share (EPS). The price-to-earnings ratio is also sometimes known as the earnings multiple.
Forward P/E Ratio: The forward price-to-earnings (forward P/E) is a version of the P/E ratio that uses forecasted earnings for the P/E calculation. While the earnings used in this formula are just an estimate and not as reliable as current or historical earnings data, there are still benefits to estimated P/E analysis.
Earnings per Share (EPS): Earnings per share (EPS) is calculated as a company's profit divided by the outstanding shares of its common stock.
Target Rate: The overall average interest rate that a central bank targets via open market operations among other measures.
Correlation: The degree to which two variables move in tandem with one another. Correlation is represented here by a "coefficient of correlation", which is on a scale of -1 to 1, with 1 meaning the variables move in lockstep with one another and a reading of -1 meaning they are inverse.
Foreign Flows: Capital flows into a country from sources outside of its borders for the purpose of investment.
Magnificent Seven (7): Apple, Tesla, Nvidia, Meta, Amazon, Alphabet, and Microsoft.