


Charging Forward: Exploring Opportunities in Electric Vehicle Stocks Amidst Market Fluctuations
By Anthony Sassine, CFA
Executive Summary
- In 2023, pure electric vehicle (EV) companies demonstrated competitive strength against traditional automotive giants. However, supply outstripped demand and led to declines in both sales and share prices. As a result, we believe valuations of EV manufacturers are currently at attractive levels relative to history.
- Advancements in battery technology are expected to drive down prices, nearing parity with internal combustion engines and, in turn, fostering widespread EV adoption.
- Shares in China-based EV makers faced selling pressure attributed to economic conditions and sentiment despite substantial growth in EV sales and industrial production throughout the year.
- Looking ahead to 2024, global EV sales are projected to increase by 20%1, with China expected to continue to dominate the market. Despite regulatory changes in the US, investment in battery infrastructure surged, presenting opportunities amidst uncertainties surrounding clean energy policies.
Introduction
Despite global EV sales growing 40% last year, performance in related equities dragged.2 The disconnect between sales growth and stock performance stems partly from more conservative growth estimates. A consensus of reports estimates EV sales to grow by 20% in 2024, which is still notable growth compared to established global industries.1
Although growth in the EV industry may normalize in the coming years, we believe the long-term picture remains the same. The world still needs to replace 1.3 billion internal combustion engine vehicles (ICE) with EVs by 2040, and we have only 40 million EVs on the road today.3 In 2023, we were once again reminded that structural growth does not always form a straight line.
We have seen this story unfold before with many cornerstone technology companies, including Google, Facebook, Netflix, and now Tesla. While sales or subscriber growth may slow for a quarter or two, the long-term transformation story remains intact. After all, we do not see anybody going back to Blockbuster to rent movies. Despite challenges, valuations and positioning are at multi-year lows, EV prices are declining compared to ICE, and technology and infrastructure are improving rapidly.
2023 Review
Pure EV companies such as Tesla, Li Auto, Xpeng, and Rivian proved their ability to compete with legacy automotive companies in 2023. Traditional ICE car companies like Ford and GM, who have introduced EVs to their existing business model, failed to show any considerable improvements last year across the board.
While fundamental growth within pure EV companies was strong last year, raw material and battery suppliers detracted due to lower demand and excess capacity in electrification metals. After record investment flowed into mining projects in 2022, the sub-industry saw an influx of supply that outpaced overall EV demand.4 We believe this imbalance will correct itself as EV companies accelerate car production to meet global demand.

On a country level, China-based EV makers sold off the most due to negative investor sentiment following two challenging years of COVID-19 closures and regulations. Despite it all, EV sales grew by 40%, and EV-related industrial production growth surpassed 30%.5 BYD, China’s leading EV maker, became the top global EV seller in Q4 of 2023, surpassing Tesla.6 It is unsurprising that BYD, like Alibaba, Tencent, JD.com, LONGi, and other pioneering Chinese companies, is taking the lead in another future industry: the electrification of transport.

2024 Overview
In 2024, we expect global EV sales to grow by 20% to 16.5 million units.7 Most of the sales are expected to be in China, which is estimated to account for about 10 million of the EVs sold globally.8 The US is expected to sell nearly 2 million EVs, representing more modest growth over 2023.9 On the other hand, European sales growth is expected to be in the single digits for the year, with around 3.8 million units.10

Excitement in the US over EVs began to weaken following the revision of the Inflation Reduction Act (IRA) to limit the number of brands that qualify for the full $7,500 credit for EV purchases. However, the IRA successfully ignited a major investment cycle not seen in many years, especially in battery factories. Furthermore, the upcoming US presidential elections could present more uncertainty for clean energy support in the coming years.
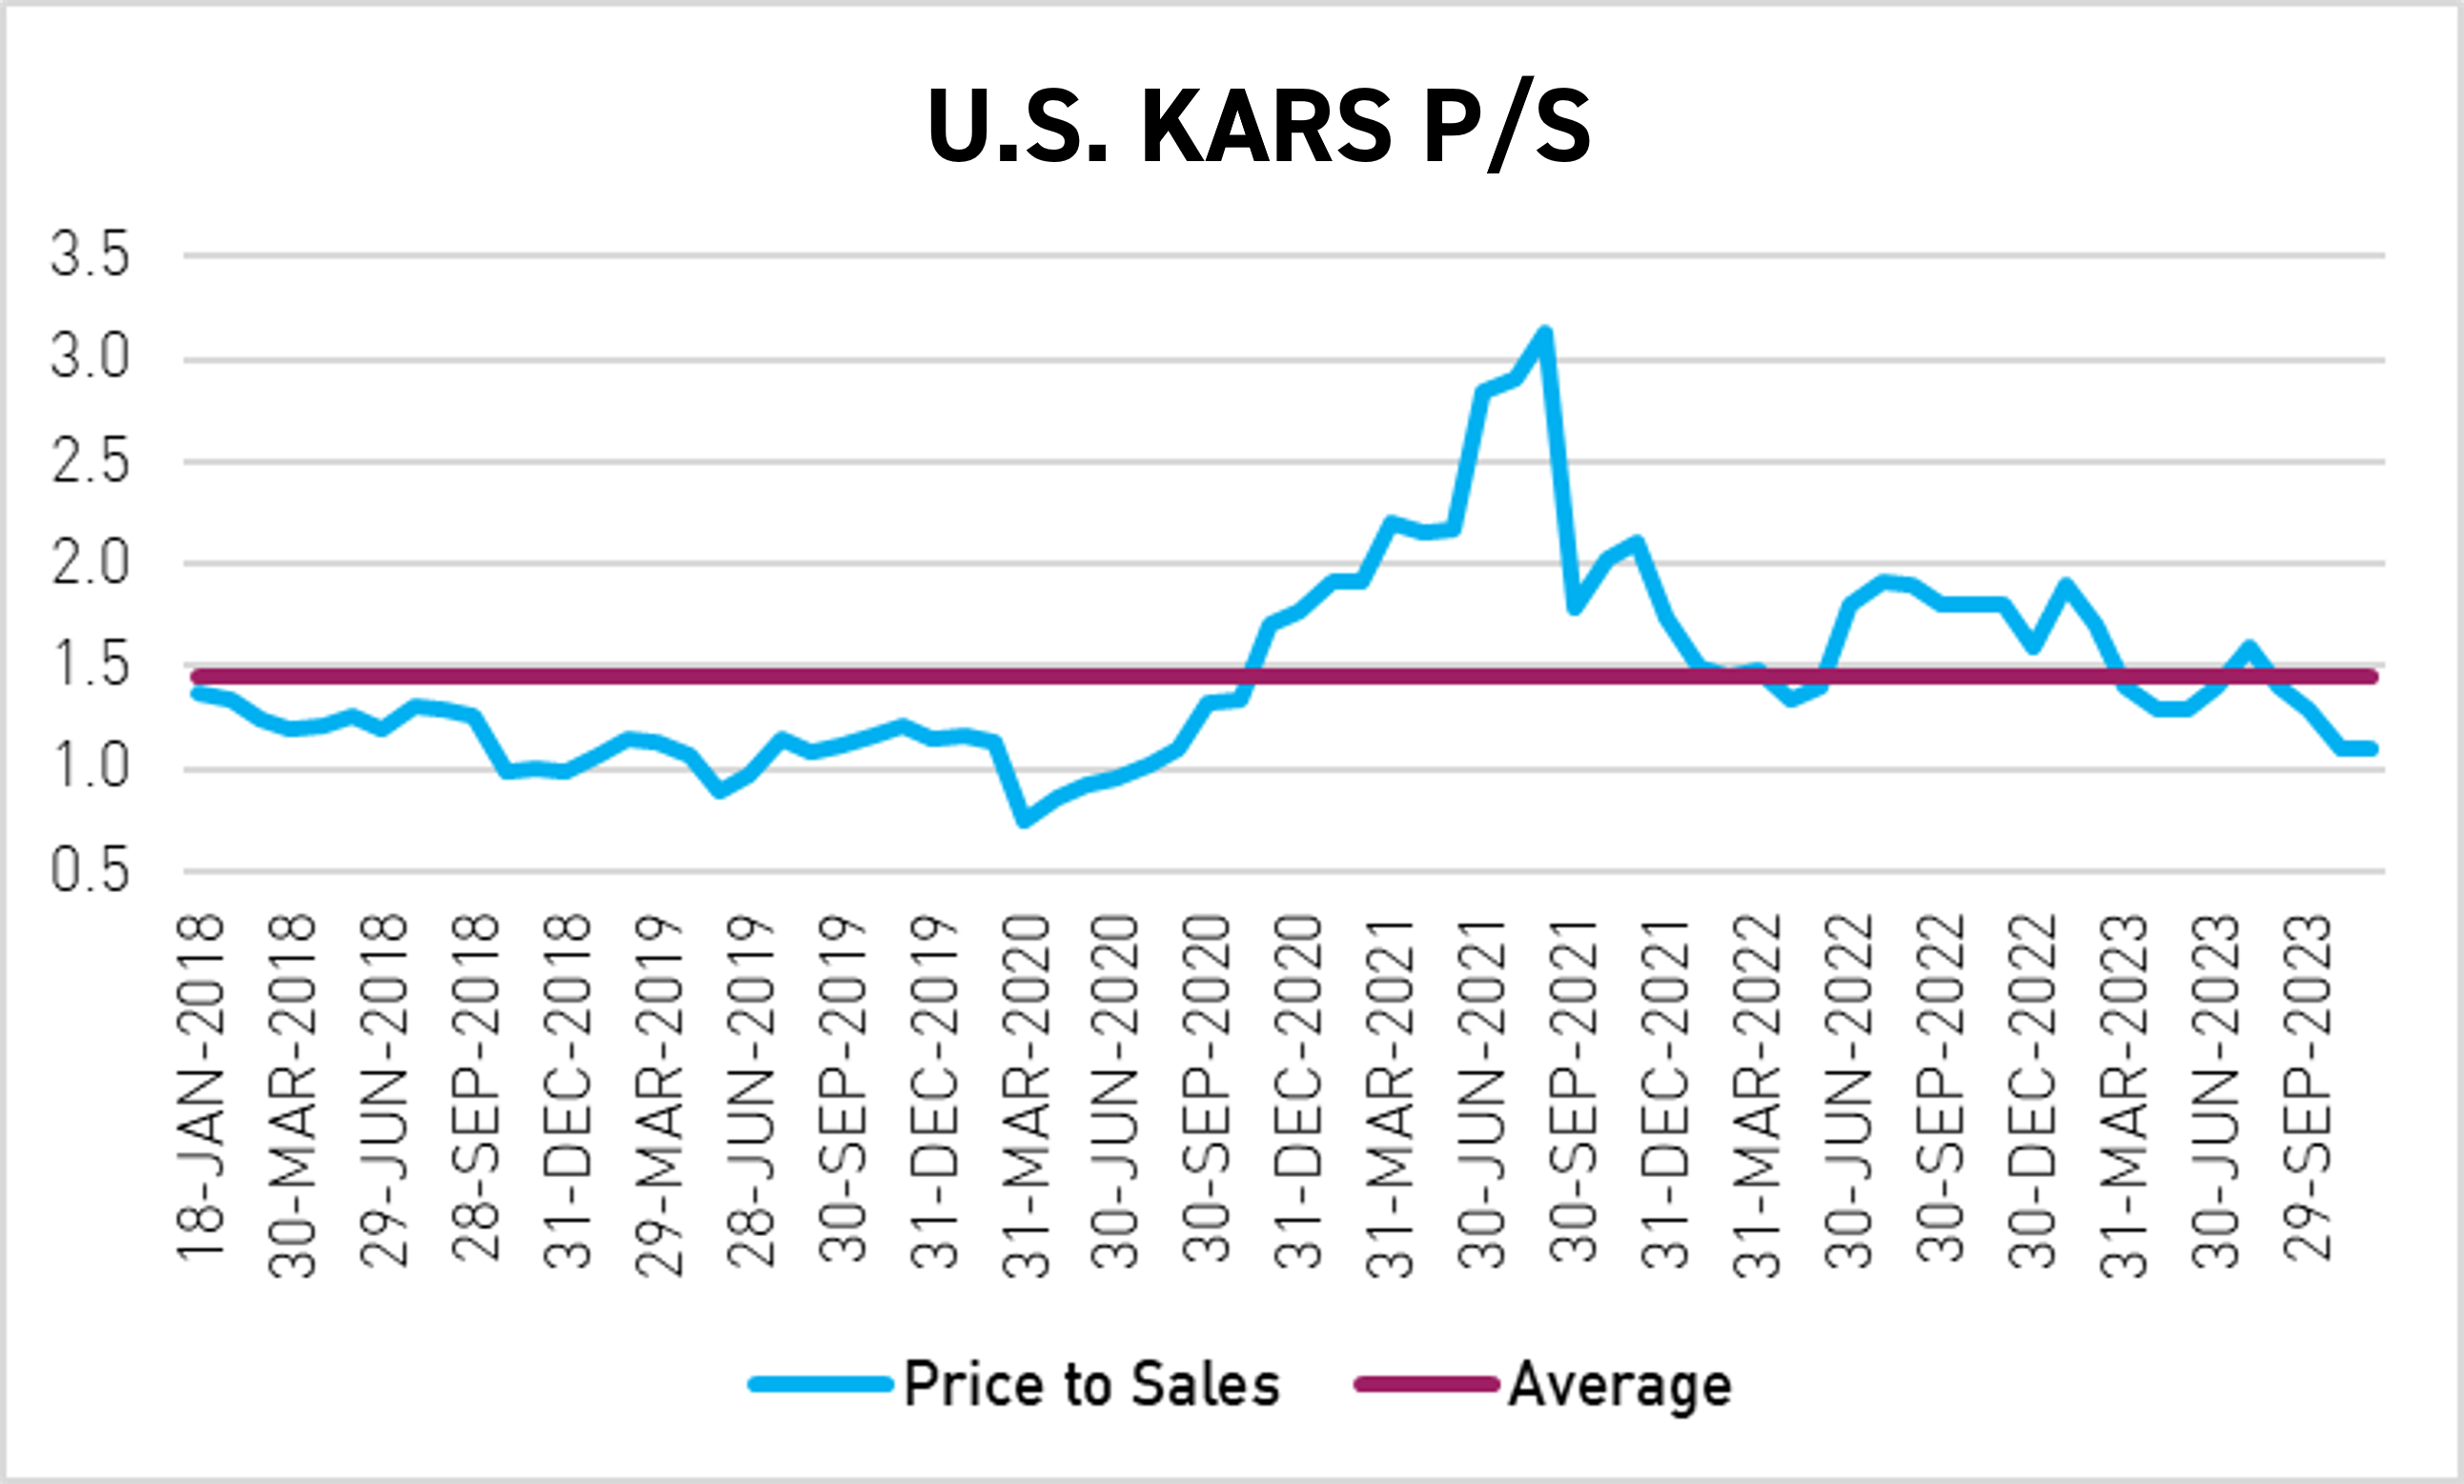
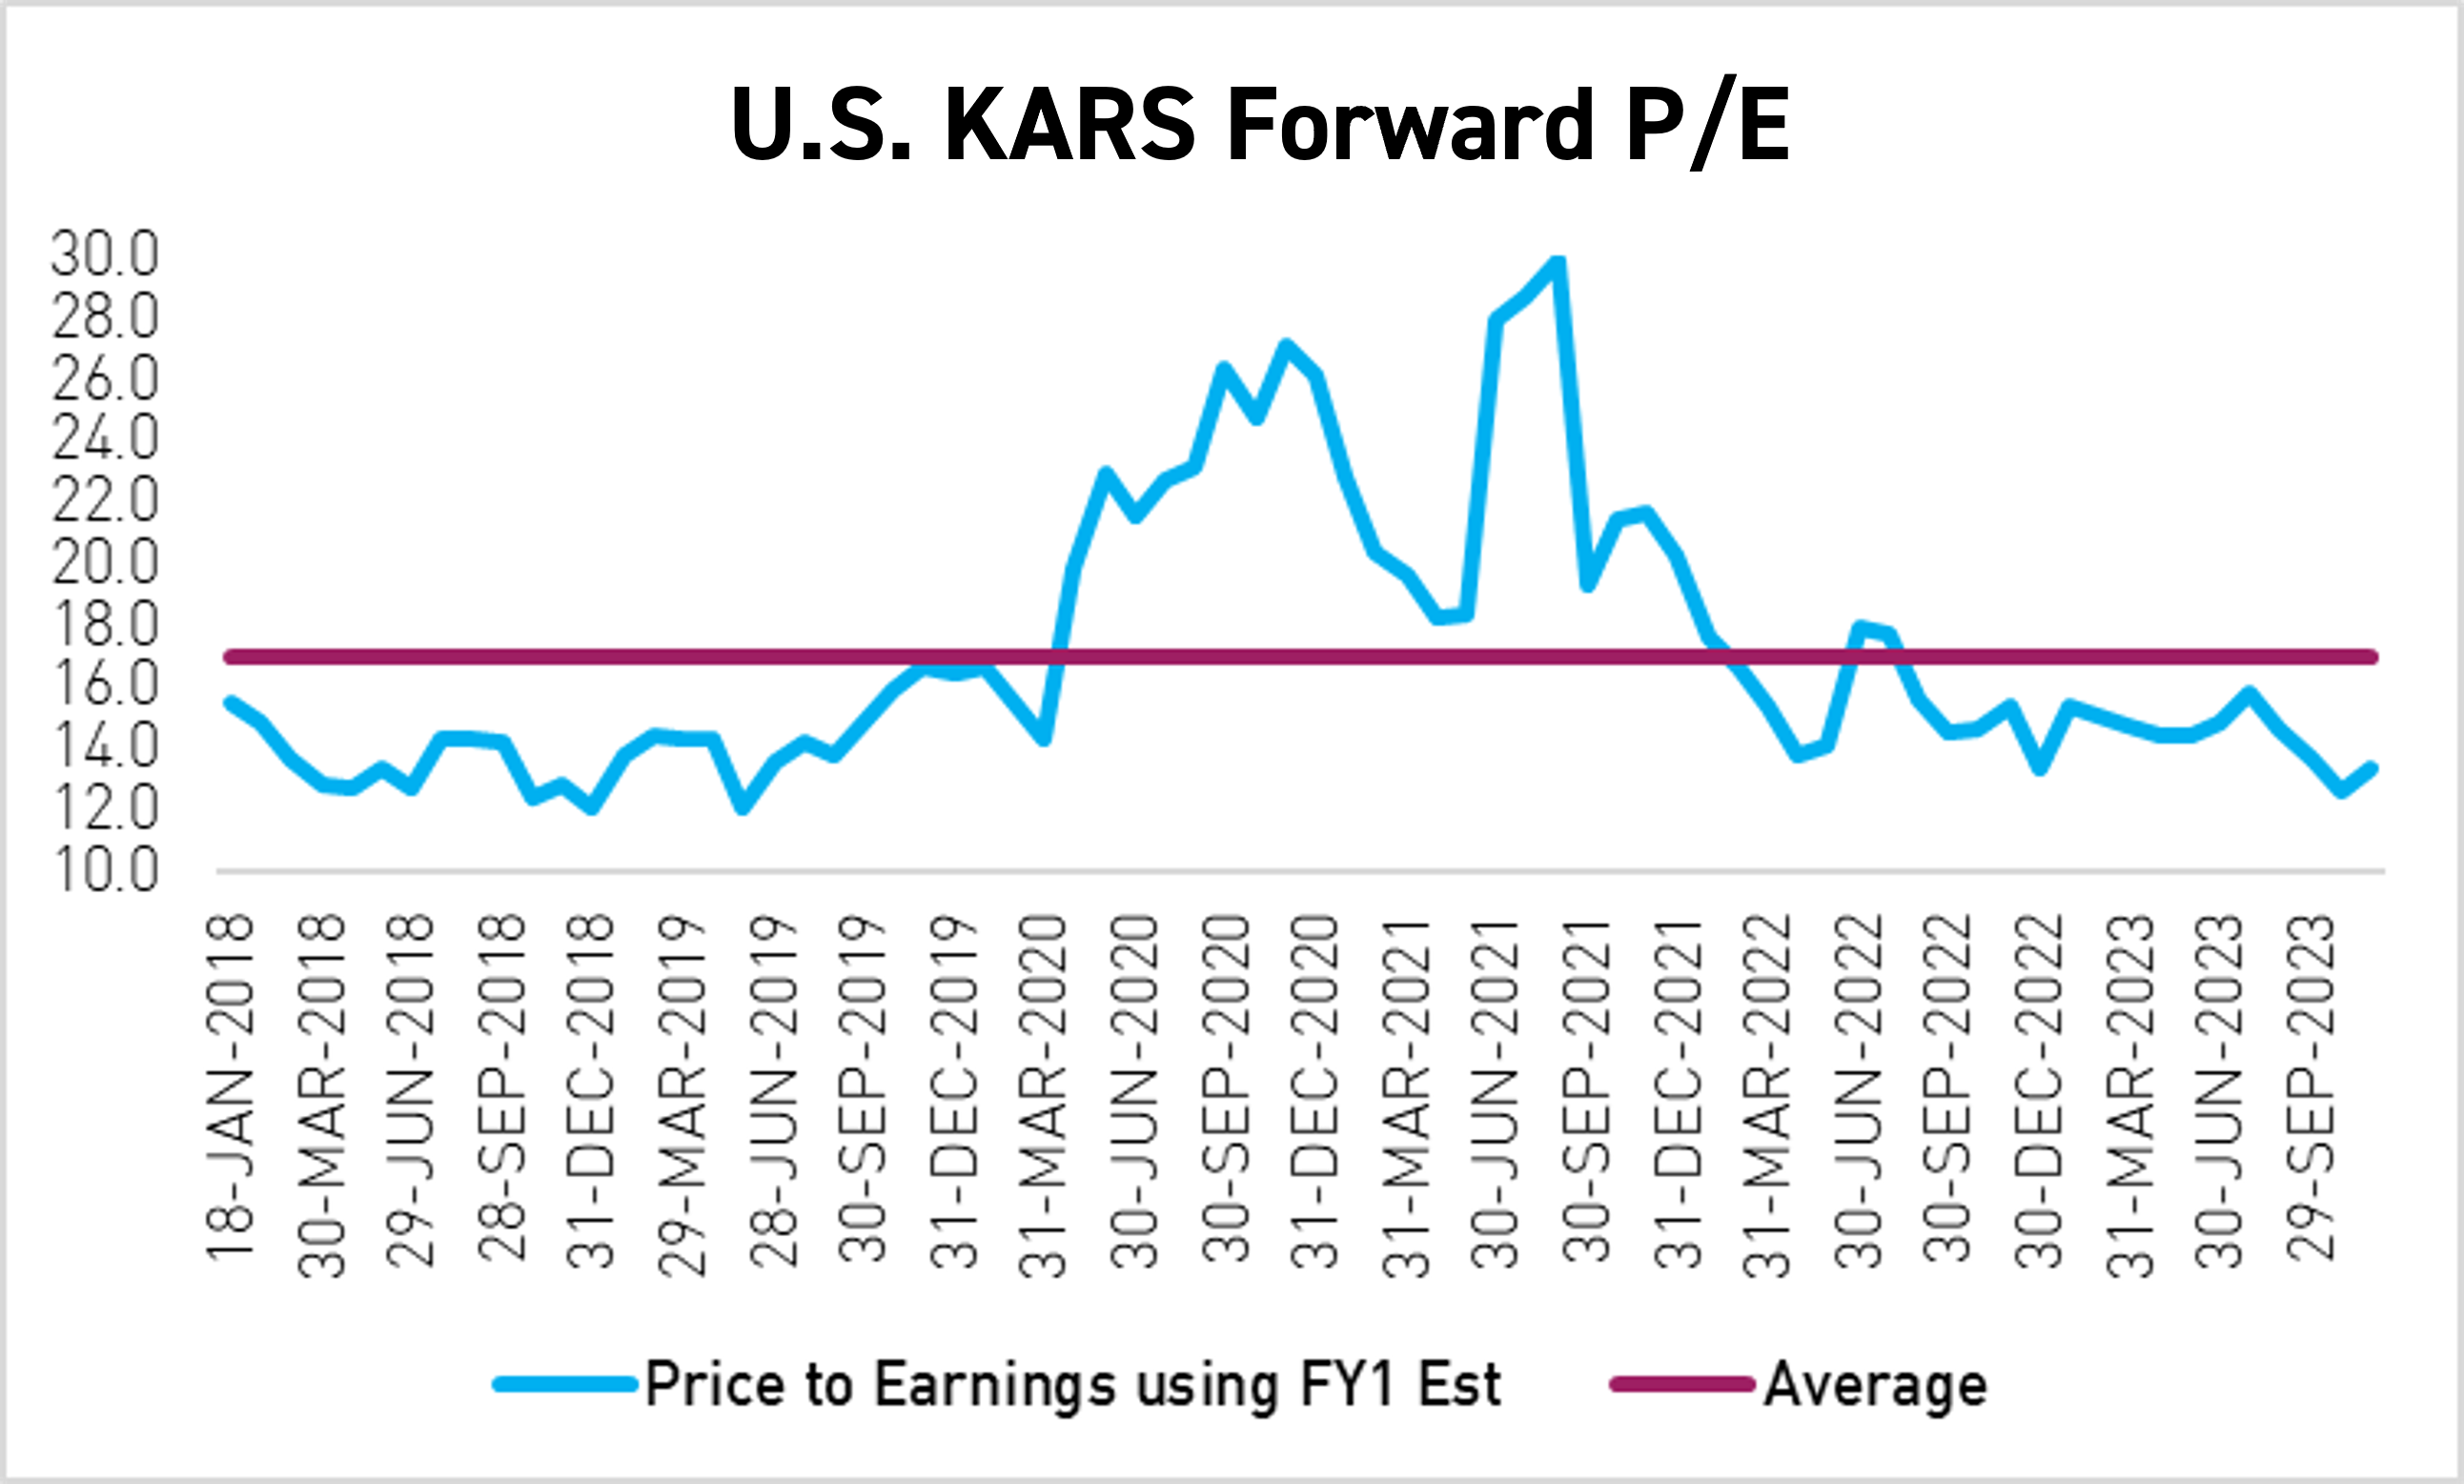
We believe EV stock valuations look very attractive, especially on a price-to-sales basis after an unremarkable start to 2024. Many of these companies are trading at a price-to-sales (P/S) level between 1 and 2.11 BYD’s P/S is 0.9.12 Meanwhile, Tesla's P/S has declined from 10 to 6 after a recent earnings miss.13
Also, positioning in the sector is the lowest it has been in many years, and sentiment is bearish. Any signs of improvement in EV sales, China’s macroeconomics, or rate cuts in the US could change sentiment quickly. Given the current environment, we favor companies with lower price tags over luxury EVs, which, in the long term, will contribute the most to closing the gap between EVs and ICE vehicles.
Battery and Metals Overview
On the battery side, pack and cell prices resumed their downward direction in 2023 after rising in 2022 for the first time in at least ten years due to high metal prices. The Cell price reached an all-time low with a weighted volume average of $107/kWh.14 Pack prices hit $32/kWh.15 This price includes inputs from all electrification segments, including Plug-In Hybrids (PHEV), Battery EVs (BEV), Stationary, E-Busses, etc. BEV battery prices in 2023 were observed at $128/KWH, while PHEV battery prices were $343/kWh.16
Prices are expected to ease further in 2024, bringing us closer to ICE parity. Absent a major technology improvement in batteries, ICE parity is expected to be reached for specific models, such as lightweight vehicles, in certain countries, such as China, in 2025. The rest are expected to follow in the following years. Cost parity with ICE vehicles is expected to unleash mass adoption for EVs.

Battery company stocks suffered in 2023 despite significantly lower metal prices due to lower-than-expected demand for EVs. Many companies, including CATL and Samsung SDI, were operating below capacity and delivered revenues and earnings that were below Wall Street's expectations. Lower metal prices usually bode well for battery makers as it cheapens their raw materials. However, due to lower demand for EVs, many battery companies had to offer increasingly competitive contracts to automakers to lock in demand in the short term.

According to Bloomberg New Energy Finance's (BNEF) yearly Lithium Price Survey released last November, Lithium-Ion Phosphate (LFP) share versus Nickel-based chemistries continues to rise, reaching an estimated 46% of the total market share. LFP is becoming more popular for battery EVs, with many North American manufacturers like Rivian and Ford switching to LFP this year. LFP currently has the cheapest battery price in the industry, at $130/kWh.17 The lower price of LFP has been supported by the large decline in Lithium prices seen in 2023 after record new capacity came online.
Risks & Catalysts in 2024
Some potential risks may emerge in 2024. The most anticipated event this year is the US election. A Republican victory could mean repealing some of the subsidies in the Inflation Reduction Act (IRA). However, given the breadth of states, including red states, that benefited from the IRA in terms of jobs and investments over the past year, we believe the impact may not be as large as expected. Examples of this include Rivian and Hyundai building new EV factories in Georgia, Fisker taking over the abandoned auto plant in Ohio, and Ford and GM planning to build battery factories in Michigan and other states. Other risks include a potentially less robust consumer recovery in China and higher rates for longer periods. However, we believe many of these factors are already priced in.
We believe bearishness on EV sales in the short term may be excessive because many factors could quickly reverse investor sentiment. Some of these factors include better-than-expected sales in Q2 and Q3, potential rate cuts in the US and Europe, a potential technological advancement, especially in batteries or autonomous driving, an improvement in consumer sentiment in China, more subsidies, and policies to encourage EV buying, especially in the EU, and the emergence of lower-priced EVs.
Conclusion
Investors can gain exposure to companies engaged in the production of electric vehicles and/or their components through the KraneShares Electric Vehicles & Future Mobility ESG Screened UCITS ETF (Ticker: KARS).
KARS is benchmarked to the Bloomberg Electric Vehicles Index, which provides exposure to companies engaged in electric vehicle production, autonomous driving, shared mobility, lithium and/or copper production, lithium-ion/lead acid batteries, hydrogen fuel cell manufacturing, and electric infrastructure businesses.
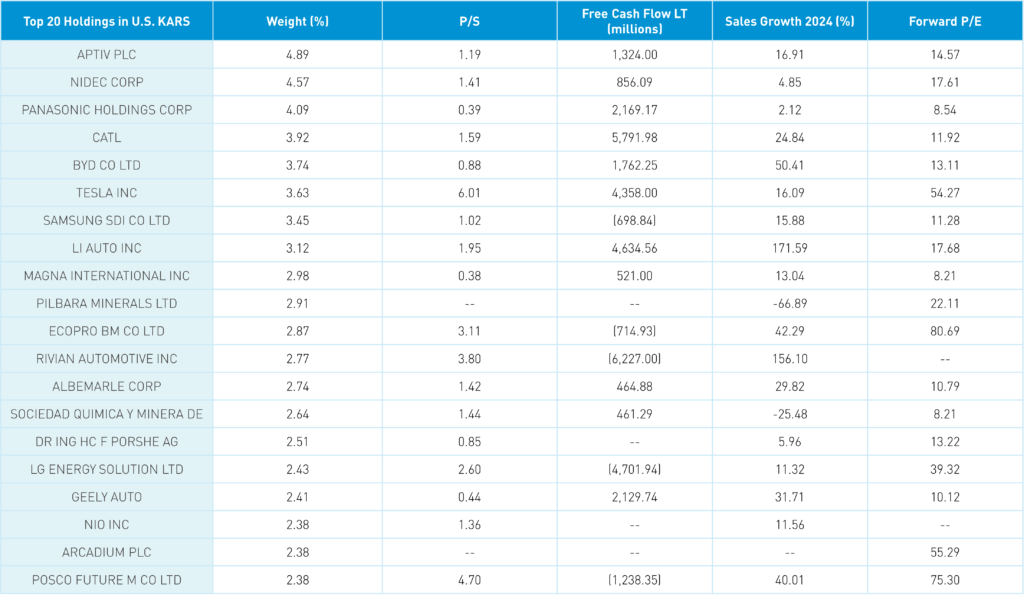
For KARS top 10 holdings, risks, and other fund information, please click here.
This is a marketing communication. Please refer to the prospectus of the UCITS, the KIID, and the PRIIPs.
Definitions:
Price-to-sales ratio: a valuation ratio that compares a company’s stock price to its revenues. It is an indicator of the value that financial markets have placed on each dollar of a company’s sales or revenues.
Free Cash Flow LT: The Long Term Average Free Cash Flow to Assets, or FCF LT / Assets, is a measure of how effectively a company generates surplus Cash Flow from Revenues. It is the Average Free Cash Flow over the last five years, divided by Total Assets.
Sales Growth: Sales growth is the increase in sales of a product or service over time. It measures how well a business performs in terms of its revenue from sales. Sales growth can be measured by comparing the year-over-year, quarter-over-quarter, or month-over-month sales.
Forward P/E: The forward P/E ratio (or forward price-to-earnings ratio) divides the current share price of a company by the estimated future (“forward”) earnings per share (EPS) of that company. For valuation purposes, a forward P/E ratio is typically considered more relevant than a historical P/E ratio.
Citations:
- Data from BNEF as of January 2024.
- Data from Bloomberg and FactSet as of January 2024.
- Data from BNEF as of January 2024.
- Data from PwC as of June 2023.
- Data from Bloomberg and FactSet as of January 2024.
- Data from Bloomberg as of January 2024.
- Data from BNEF as of January 2024.
- Data from BNEF as of January 2024.
- Data from BNEF as of January 2024.
- Data from BNEF as of January 2024.
- Data from FactSet as of January 2024.
- Data from FactSet as of January 2024.
- Data from FactSet as of January 2024.
- Data from BNEF as of January 2024.
- Data from BNEF as of January 2024.
- Data from BNEF as of January 2024.
- Data from BNEF as of January 2024.