


Electric Vehicles Rebounding as Sales Surge
The road ahead looks clear for electric vehicles (EVs). Negative sentiments surrounding EVs are dissipating as China extends its tax breaks for the next four years, inflation and rates in the US seem subdued and accelerated sales and pre-orders driven by price cuts and new products. Recent June EV sales for Tesla and Chinese EVs are encouraging after a period of doubt from investors on EV demand. Tesla EV sales for Q2 exceeded expectations by a healthy margin1, as well as good progress in Chinese EVs sales especially compared to the last two quarters2. We believe this is an exciting time to consider investing in the EV ecosystem following a tough year, with more indication of a rebound and dissipating risks.
In 2023, progress towards global electrification continued as EV sales reached 4 million during the first 5 months of 2023, growing 32% in Q1.3 Despite the promise of innovation and research in the field of battery technology, such as solid-state, sodium ion, or innovative anode technology, we still await a significant breakthrough in vehicle range on a single charge. However, the focus on building EV infrastructure and supply chains intensified this year with an increasing number of electric chargers being built and continued government policy support.
In this report, we will address:
- The long-term opportunity for the EV ecosystem
- EV sales and growth potential
- Advancements in battery innovation and infrastructure building.
- Performance of the KraneShares Electric Vehicles & Future Mobility ESG Screened UCITS ETF (Ticker: KARS)
- Performance drivers for electric vehicle companies.
The Long term view
While short-term price fluctuations and events may grab attention, it is crucial to adopt a long-term perspective when considering the electric vehicle market. We always remind investors that electrification is a marathon as we embark on a mission to replace 1.3 billion internal combustion engines (ICE) with electric vehicles. Estimates point to 40 million EVs on the road by the end of 20234.
Source: Bloomberg New Energy Finance (BNEF). Data as of June 2023.
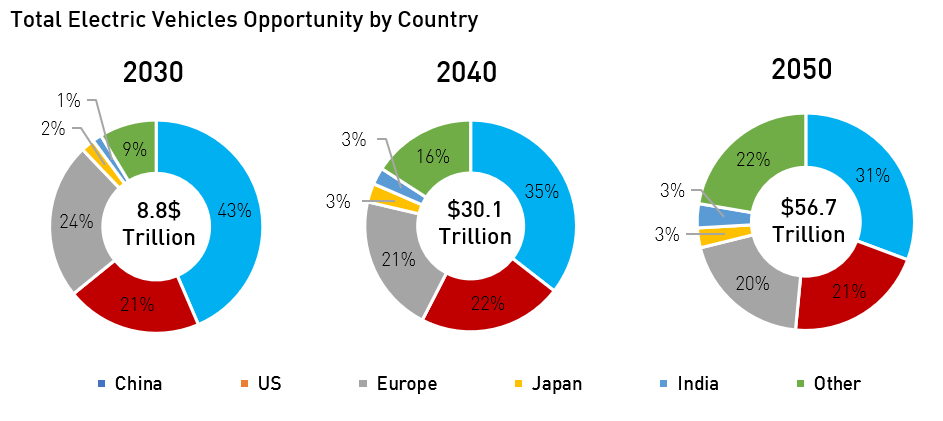
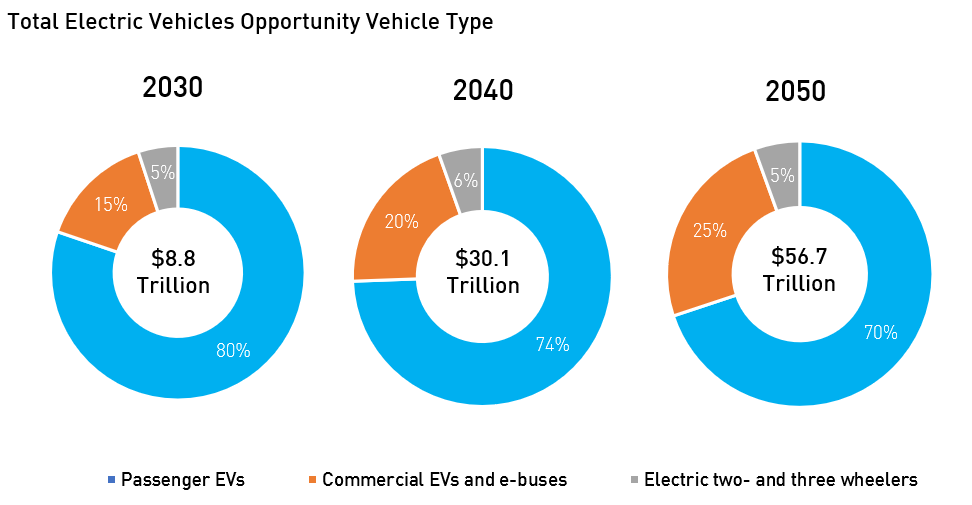
The BNEF 2023 outlook projects that the electric vehicle market will reach approximately $8 trillion by 2030 and $56 trillion by 2050, with passenger vehicles being the major driver. In addition to its long-term growth potential, KARS ETF’s broad exposure to the EV ecosystem, and its low overlap with MSCI ACWI and S&P 500% (Less than 2.3%)5, make it a good potential diversifier* to any global equity portfolio. We believe a basket approach is attractive as single stocks can be rewarding but volatile. Our view is, why try to guess which stock will grow market share faster when the whole pie is growing?
*Diversification does not ensure a profit or guarantee against a loss.
We work with Bloomberg Indices and Bloomberg New Energy Finance to put together KARS, a comprehensive, pure, and balanced exposure to the EV ecosystem.
Source: Bloomberg New Energy Finance (BNEF). Data as of June 2023.
Passenger EV Sales Growth and Competition
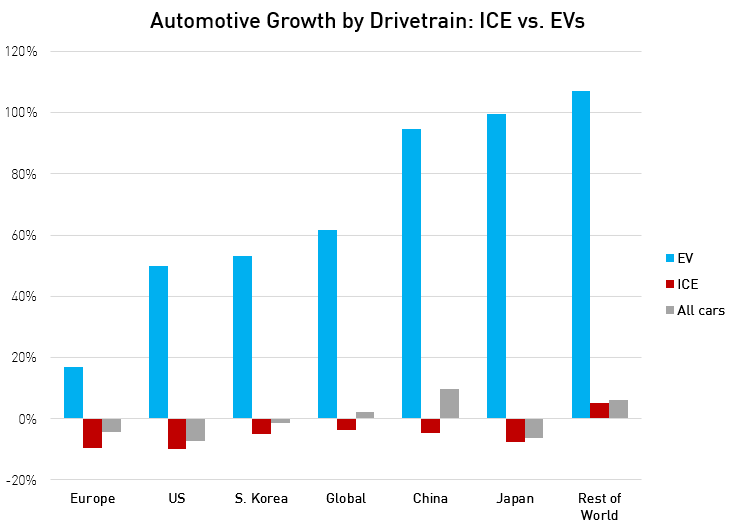
Despite macroeconomic challenges, electric vehicles continue to be a rare source of growth for global investors. Most major pure EV makers delivered strong results beating analysts' expectations by a healthy margin1. This illustrates the potential diversification benefits obtained from investing in electric vehicles as growth tends to be more driven by energy transition tailwinds than economic cycles. The diversion in economic performance and growth exists even within the auto industry as ICE cars continue to see negative growth while EVs are growing globally. BNEF estimates that the peak for ICE car sales was in 2017. By 2030, ICE sales could be as low as 39% below the peak. It is a steep drag on traditional automakers whose sales are predominantly ICE Vehicles. The diversion is expected to accelerate further as we hope to reach ICE parity in the next few years.
Source: BNEF. Data as of June 2023.
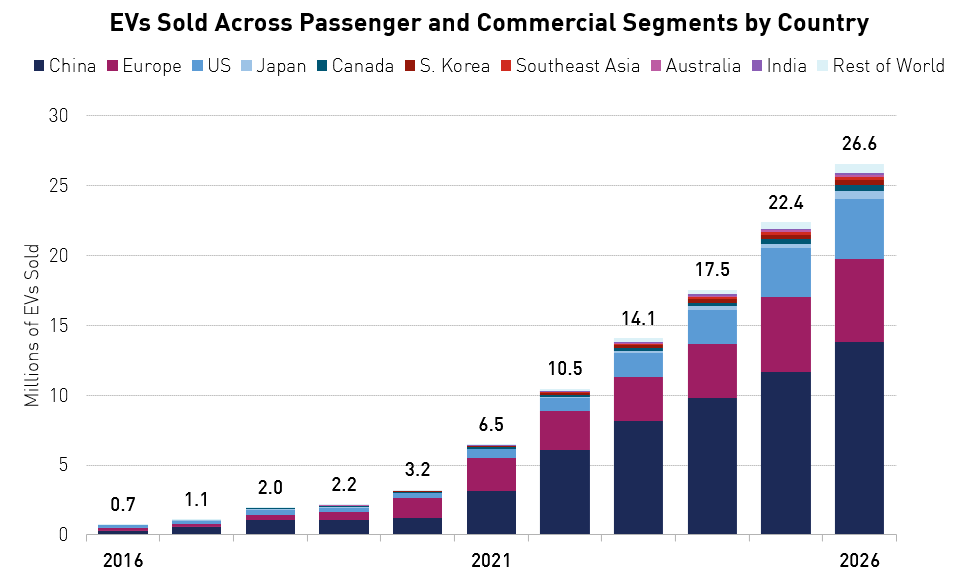
BNEF anticipates close to 14.1 million EVs sold in 2023 across passenger and commercial segments. That is an estimated 37% growth in sales for 2023. Not all carmakers have seen the same success this year. For one, we believe the competition in the EV segment seems to be more defined than at any time before.
Source: BNEF. Data as of June 2023.
Traditional car makers like Ford, GM (General Motors), and Volkswagen seem to be having more challenges than expected in terms of designing EVs and scaling their EV operations. That leaves the pure EV automakers like Tesla, BYD, NIO, and others firmly in the lead, at least for the next 2 to 3 years. Additionally, traditional automakers have a declining ICE business to manage, which may take away from their effort and focus on the transition. Ford announced recently that it is pulling out of China, especially the passenger vehicle segment, due to severe competition.
Source: EV Volumes. Data as of June 2023.
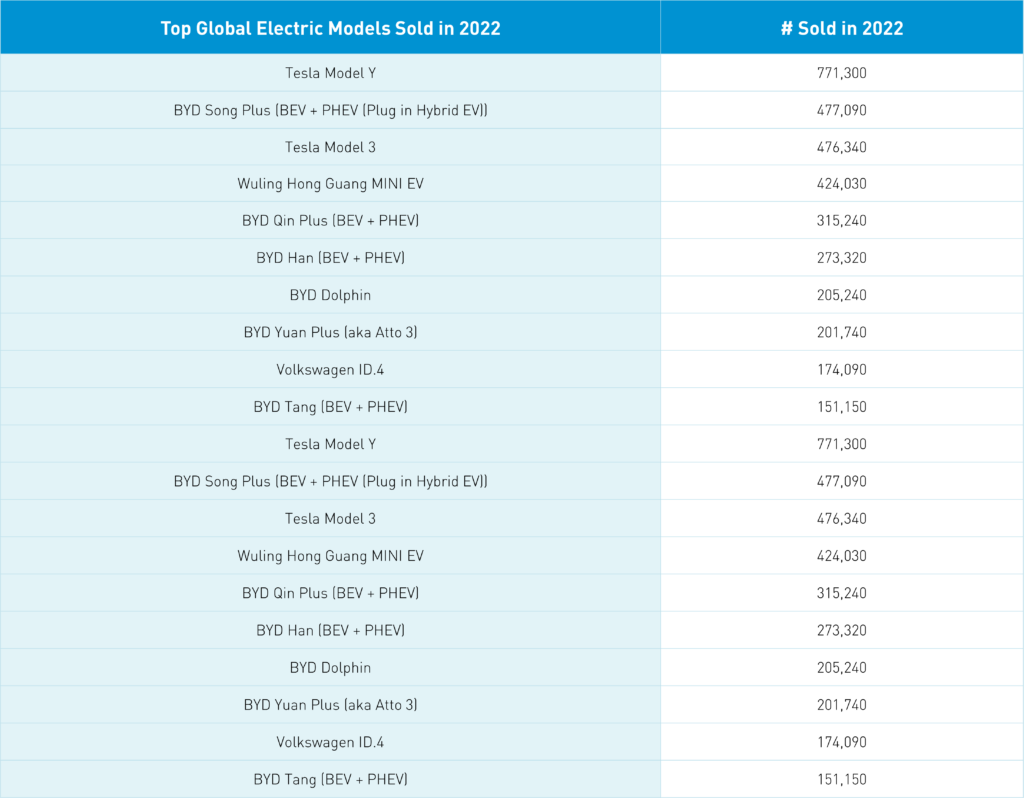
The tight micro-environment this year has forced EVs to cut prices, revealing in the process some leaders and laggers among the pure EVs rank. Tesla is firmly ahead, given its vertical integration across EVs, batteries, and components and given its dominant brand and manufacturing ability. BYD has surpassed Tesla so far this year in Battery Electric Vehicles (BEV) for the first time. BYD is also vertically integrated with a successful battery business that gives its products a valuable cost advantage.
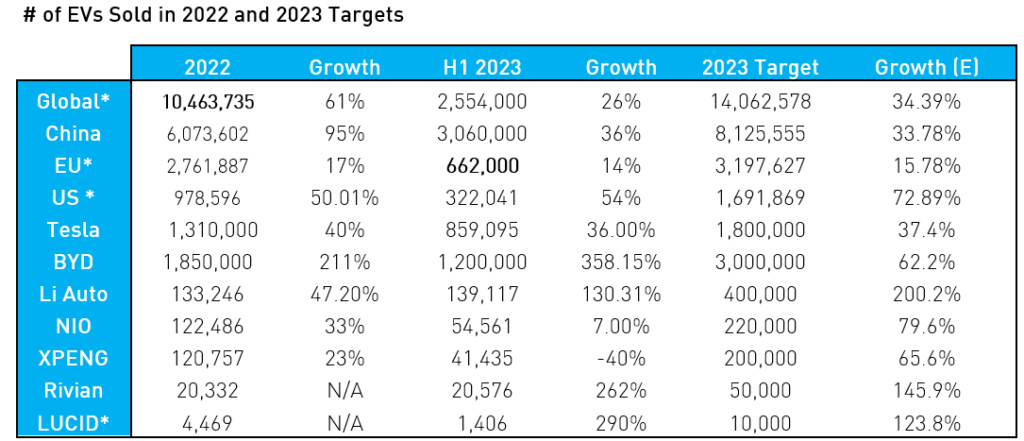
As for the Chinese EV start-ups, Li Auto has achieved stunning results in terms of strategy execution and sales year-to-date. Li Auto was able to become profitable towards the end of 2022, giving investors more confidence in its management and its plugin hybrid electric vehicle (PHEV) and family-focused strategy. NIO and Xpeng are going through a product cycle revamp again in 2023. The second half of the year will be key for both companies to prove that they can meet their targets and consumer tastes within the premium car market.
Source: Company data, KraneShares, and Bloomberg. Data as of June 2023. * Data as of Q1 of 2023 due to unavailability.
Battery Innovation and Charging Infrastructure
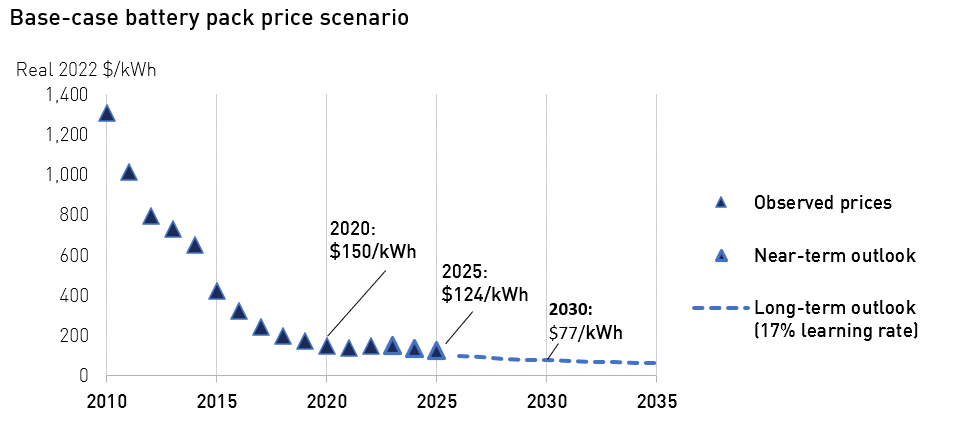
Innovation over the past decade resulted in a 90% reduction in battery prices3. However, more is needed to reach ICE Parity, which means an equal cost of production for equivalent EVs and ICE cars without subsidies. Unfortunately, Battery prices increased in 2022 for the first time in at least 10 years due to high metal prices. While the price increase is only short-term, it has delayed the expected ICE parity. BNEF now expects some EV models in China to hit ICE parity by 2025. We believe the rest of the models in different countries should follow in the years ahead.
We are seeing progress in the development of battery technology, but no breakthroughs to report yet. Innovative technologies like solid state, sodium ion, hybrid batteries, and others are in development and implementation. The most promising with regards to the range is potentially the solid-state battery, but it will take years to develop. Hybrid batteries, which use both Lithium-Ion and Nickel based chemistries in the same battery for different driving needs, will help extend the range on a single charge by 15% to 20%7. CATL (Contemporary Amperex Technology) announced earlier this year it will be deploying its first sodium-ion batteries commercially in a Chery car soon. Although this is welcome news, sodium-ion batteries have lower energy density than lithium-ion ones.
Source: BNEF. Data as of June 2023.
Understanding the composition of an actual battery and the value chain can help investors understand how innovation could work to extend the battery range. Whether “cylindrical” or “boxy” style, all batteries consist of cathodes, anodes, electrolytes, and separators. The separator stands in between the cathode and the anode to avoid short circuits, and electrolytes carry the lithium ions back and forth between the two. The battery value chain comprises anode materials, cathode materials, and battery manufacturing. Currently, we are seeing attempts from various companies to experiment with various chemistries for the cathode and anode (lithium vs. Nickle vs. Sodium ion or Graphite vs. Silicon) or different states for the electrolyte liquid vs. solid-state electrolytes) to increase energy density and range.

Source: BNEF. Data as of June 2023.
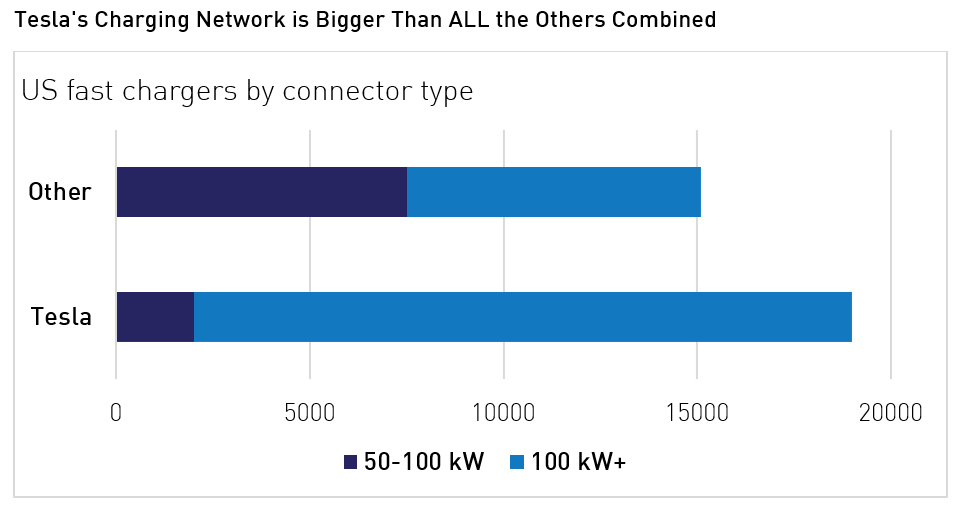
On the infrastructure side, recent months have presented some interesting events that could be beneficial for the US market. Within weeks, Ford, GM, and Rivian announced a deal with Tesla which allowed them to access Tesla’s nationwide fast-charging network. The deal should provide EV buyers with more confidence. Tesla has the largest charging network in the country. Some states and companies are starting to put plans and laws forward to convert charging outlets to the North American Charging Standard (NACS) charger used by Tesla.
Source: BloombergNEF, Eco-Movement. Data as of June 2023.
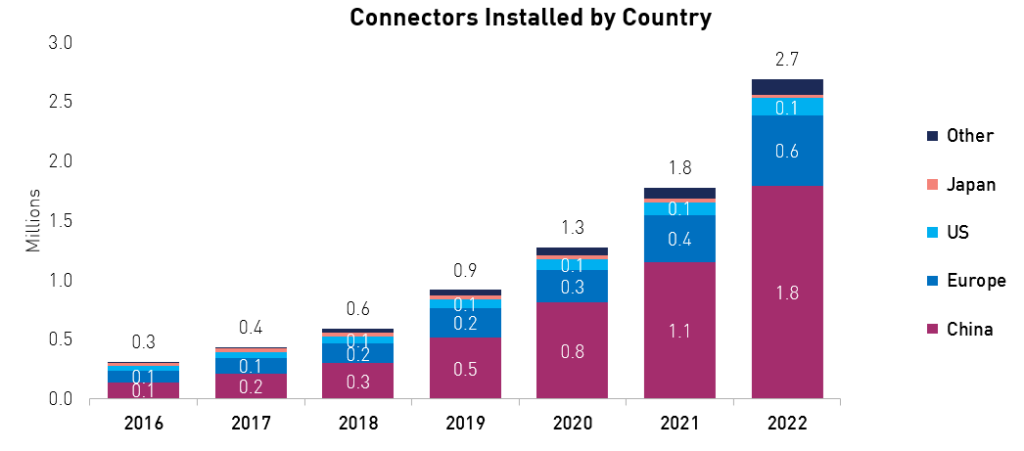
The tally for global EV connectors continues to grow closer to 3 million3. Two-thirds of these connectors are currently installed in China. Europe continues to make progress, albeit at a slower pace. As we wait for a breakthrough in battery technology, we believe the easier solution is to make charging available on every corner and every street to alleviate range anxiety and accelerate adoption. We are making progress, indeed!
Source: BNEF. Data as of June 2023.
KARS Performance Review and EVs Value Drivers
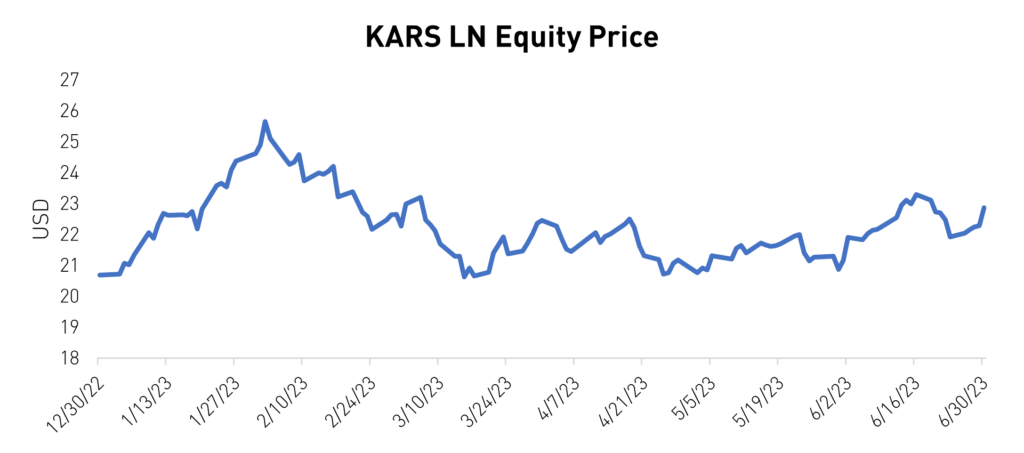
While the KraneShares Electric Vehicles & Future Mobility ESG Screened UCITS ETF (KARS ETF) is down 10.76% over the past year, the fund is up 10.33% YTD1. It has been a tough year for electric vehicles. Ever since investors caught wind of higher rates in the US and dissipating Chinese EV subsidies starting end of 2022, the market began repricing the 2023 demand for EVs negatively. Furthermore, the elevated metals prices last year due to the war in Europe and lockdowns in China compounded negative sentiments.
Source: Bloomberg. Data as of June 2023
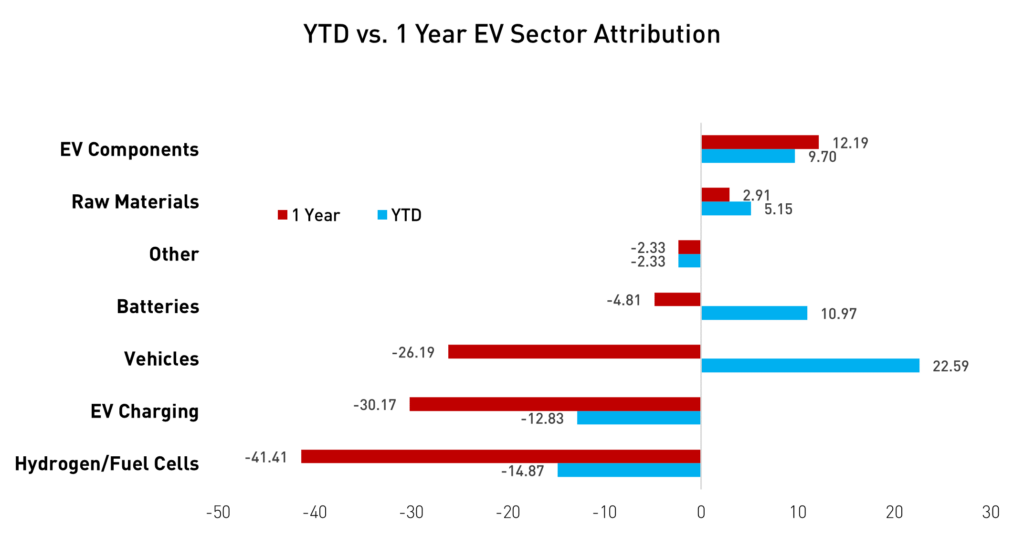
January was off to a 19% rally for KARS ETF following positive news regarding China’s reopening and declining metal prices. The unfavorable US inflation print towards the end of January, coupled with price cuts from EV makers, spooked investors again. We believe negative sentiments on EVs have started to clear up following upbeat q2 and June EV sales and further government support. Looking at KARS ETF’s one-year attribution, only EV components and raw materials stocks were positive during that period, while EVs and batteries stocks declined 26.19% and 4.81%, respectively.4 The year-to-date data is more optimistic. EVs and battery companies are up 22.59% and 10.17%4, respectively, and momentum continues to build.
Source: FactSet. Data as of June 2023.
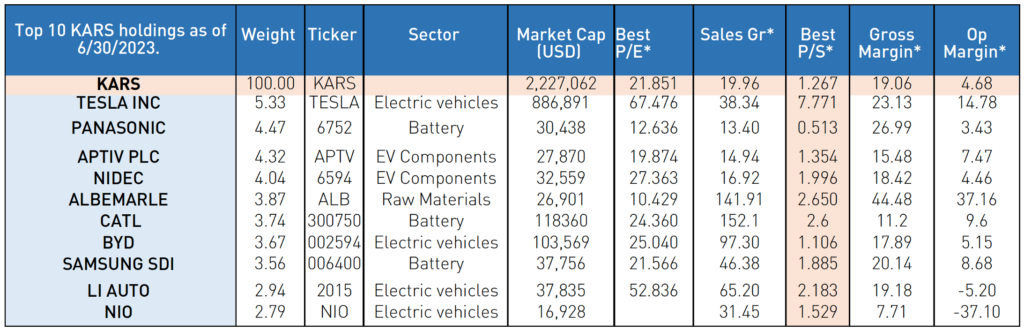
Source: Bloomberg. Data as of June 2023. Holdings are subject to change. *Please see definitions below.
Despite the run-up in stock prices for Tesla and others, we believe the EV ecosystem continues to be undervalued. Most companies of KARS’ top holdings are expected to deliver strong growth in the next few years4. The price-to-sales ratio of the fund is close to 1.26. With growth companies that are reinvesting in their business, sales growth and margin trends become more valuable than earnings growth. It is not enough for a company to design and produce an EV. It must be able to scale and sell hundreds of thousands of EVs per year while maintaining a reasonable cost of production and research and development.
Most EV companies that have made it thus far have clear long-term plans for creating platforms and processes that are focused on technology quality, creating a path to profitability, and scaling up operations. If companies’ operations continue to be on track and improving, we believe they should be able to extract long-term value for investors. Continuous government support and shifting consumer tastes may serve as a conducive backdrop for these companies to thrive and potentially beat expectations, just like we saw recently.
Conclusion
While EVs have experienced short-term setbacks, the long-term opportunity remains evident. We are confident that many of these companies have multiple levers to pull that could unlock further value in the long term. For instance, Tesla’s recent emergence as the leading supplier of EV charging services in the US has created an entirely new business segment, estimated by some analysts to be worth $100 billion8. Autonomous driving could be another wild card in the coming years. Advancements in autonomous technology have the potential to open lucrative revenue streams and fuel growth for companies in the EV industry. Lastly, any innovation in battery technology or manufacturing that accelerates EVs' price parity with internal combustion engine (ICE) vehicles could significantly impact consumer adoption and demand. For these reasons, we believe exposure to the EV ecosystem in a global equity portfolio can enhance long-term alpha and diversification potential for investors.
For KARS standard performance, risks, and other fund information, please click here.
This should not be regarded as investment advice or a recommendation of specific securities. Holdings are subject to change. Securities mentioned do not make up the entire portfolio and, in the aggregate, may represent a small percentage of the fund.
This is a marketing communication. Please refer to the prospectus of the UCITS, the KIID, and the PRIIP before making any final investment decisions.
Citations:
- Bloomberg as of June 2023.
- Company data & Bloomberg as of June 2023.
- BNEF Electric Vehicles Outlook. June 2023.
- FactSet. Data as of June 2023.
- Morningstar as of June 30th, 2023.
- Company data.
- Our New Energy (ONE) Company website as of June 2023.
- Morgan Stanley as of July 2023.
Definitions:
Price to Earnings Ratio (P/E): The P/E ratio is calculated by dividing the market value price per share by the company's earnings per share.
Forward P/E Ratio (Best P/E): The forward P/E ratio is a current stock's price over its "predicted" earnings per share. Analyst estimates are not set in stone and can often be wrong.
Sales Growth (Sales GR): Sales growth is a measure of the change in revenue over a fixed period of time. Comparing revenue between two fiscal periods demonstrates the rate of growth – positive or negative, of a business.
Forward Price to Sales Ratio (Best P/S): Forward Price to Sales Ratio is the current stock price over the predicted sales per share. While similar to the price to sales ratio, this is a forward looking estimate of a company's sales.
Gross Margin: The term gross margin refers to a profitability measure that looks at a company's gross profit compared to its revenue or sales. A company's gross margin is expressed as a percentage. Gross profit is determined by calculating gross sales. The higher the gross margin, the more capital a company retains, which it can then use to pay other costs or satisfy debt obligations. The revenue or sales figure is gross revenue or sales, less the cost of goods sold (COGS), which includes returns, allowances, and discounts.
Operating Margin (Op Margin): Operating Margin is the ratio of operating profits to revenues for a company or business segment. Expressed as a percentage, the operating margin shows how much earnings from operations is generated from every $1 in sales after accounting for the direct costs involved in earning those revenues.