


China Internet Back to Outperformance in January

January Market Key Highlight
In January, we witnessed a sharp bond sell-off led by higher real yields, reflecting investors' concerns over a more hawkish Fed; both U.S. and global equities experienced a pullback in light of this development. At the Federal Open Market Committee (FOMC) meeting, Chair Powell emphasized the "economy is quite different, it's stronger, inflation is higher, and the labor market is much, much stronger than it was." He then repeatedly stressed the Committee would need to be "nimble" concerning the course of policy and suggested there was "quite a bit of room to raise rates." Markets interpreted this as a signal for the Fed to halt its net-asset-purchases and start raising rates in March potentially.
Thus far this year, the CSI Overseas China Internet Index outperformed MSCI ACWI by 500 basis points (bps) S&P500 Index by 530bps, and Nasdaq by 910bps, a reverse trend from 2021's performance league table (see table below).
Pro-Growth Allocation in China
The increasingly hawkish signals from developed market central banks put upward pressure on bond yields and seemingly caused a growth-to-value rotation in equities. However, we see both technical analysis and fundamental conditions supporting the view to stay invested in China's growth stocks.
The unprecedented level of regulations introduced in 2021 created market volatility. Though the intention was to remove potential risks in the system, investors were surprised by the intensity and scale at which the regulations were announced and implemented. We saw aggressive revising down on earnings and re-pricing on valuations for China Internet companies. On average, the sector is currently trading at 18x earnings compared to 32x for its U.S. counterpart1. The pullback created an attractive entry point for long-term investors from a fundamental perspective.
We expect policies to stay accommodative in supporting economic growth and the transition to green investment. We believe that policymakers in China will shift the focus from de-risking towards supporting development in 2022. We have already seen the People’s Bank of China (PBoC) put this in action by cutting rates and re-emphasizing the broad economy's support in their January press conference.
More evidence led us to believe that we have progressed to the regulation implementation phase. The focus is now on how companies can achieve goals set by the government in dealing with carbon emissions, such as: promoting future mobility, opening up the financial market, and supporting China technology companies to become world leaders, which are contributors to sustainable long-term growth for China.
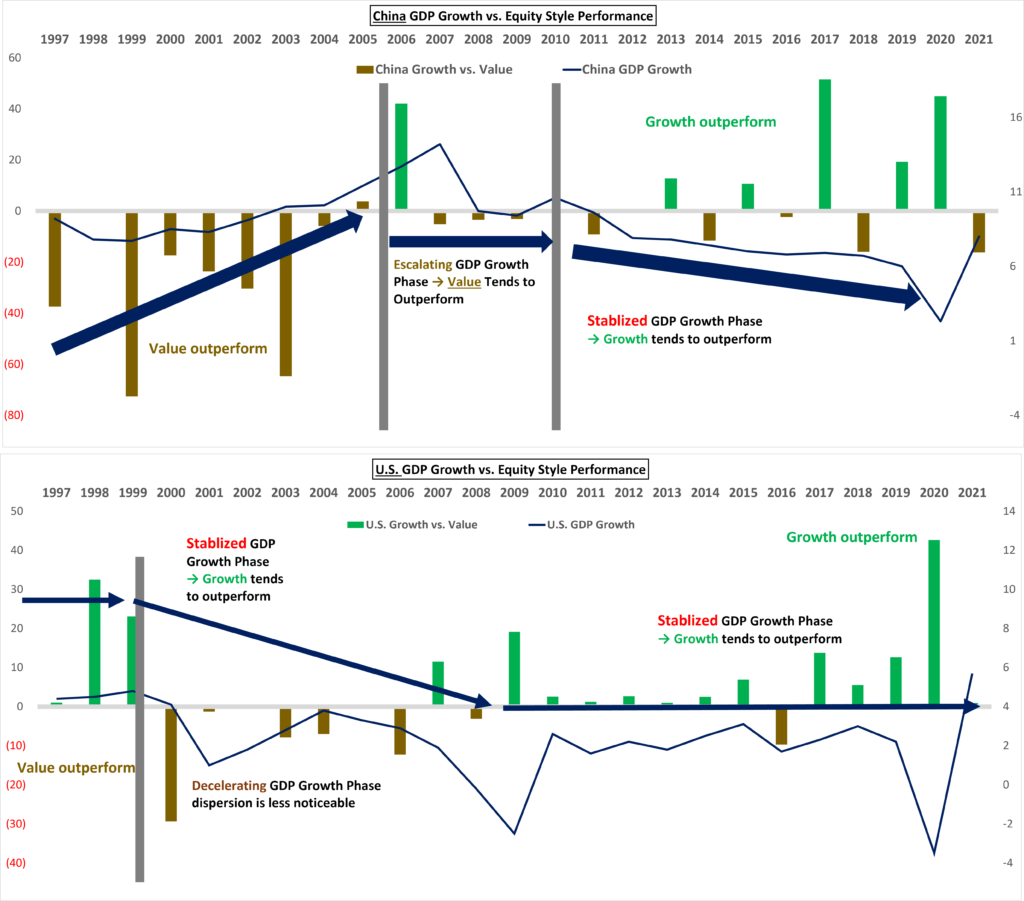
The technical analysis shows a supportive outcome to our fundamental view. The historical pattern between GDP growth and outperformance of Equity-style shows 1) during an accelerating GDP growth period, Value stocks tend to outperform growth. 2) If GDP growth starts to decelerate, the dispersion is less noticeable in finding a settled range. However, 3) if GDP growth is normalized in a relatively lower but stabilized range, growth stocks tend to outperform. The same trend was also observed in the United States.
Given our macro expectation is that China will stabilize its GDP growth at around 5% from 2022, together with supportive domestic liquidity, that is a combination that could bode well for Growth premium expansion. That gives us the comfort to prefer growth-oriented equity in China for 2022.
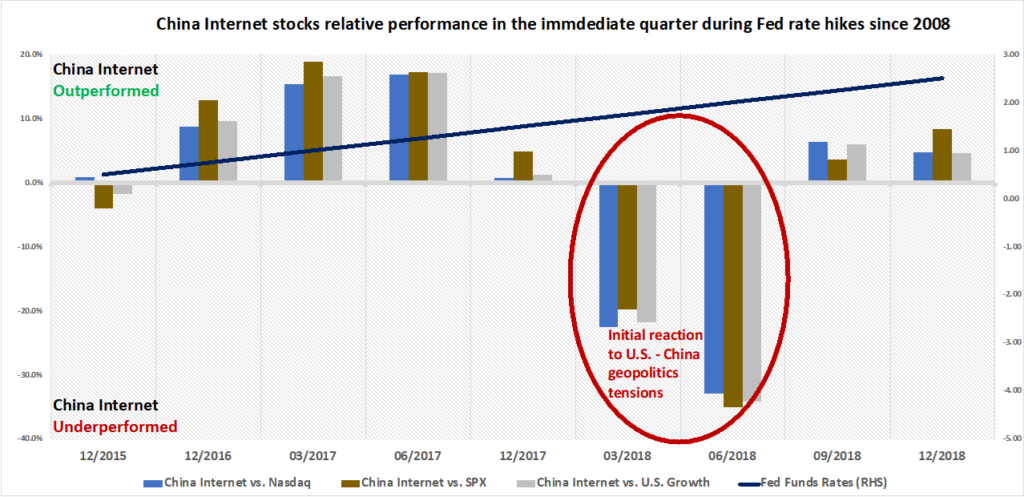
We also studied the relative performance of the latest quarter during the prior tightening cycles for the last 13 years between a few U.S. indices and the CSI Overseas China Internet Index. And we found China's Internet sector outperformed Nasdaq, S&P500, and the U.S. Growth index for 7 of the last nine rate-hike cycles since 2008.
With the exception of the scenarios in the 1H 2018, where China Internet stocks underperformed, other indices were mainly due to a rise in geopolitical tensions which surprised global investors. The Goldman Sachs index shows that US-China geopolitical tensions rose sharply from 0 to over 60% from January to June 2018. The steepness of the rise and scale of the change was reflected in the level of the market pullback. We don't expect this to repeat again, particularly at the current elevated level, which leads us to believe the broad tensions are now priced in.
Each cycle is embedded with its macro conditions. After removing the periods impacted by geopolitical uncertainties, China Internet stocks in aggregate outperformed each index by over 50-60% during all the tightening cycles.

The market expects China to expand fiscal spending and the PBoC to inject liquidity this year, opposite the majority of the developed market central banks tightening. So, the pro-growth policy, attractive valuations, and the potential performance catch-up from last year could catalyze China Internet stocks to outperform.
Global Indices Returns at a Glance (as of 31-Jan-2022):
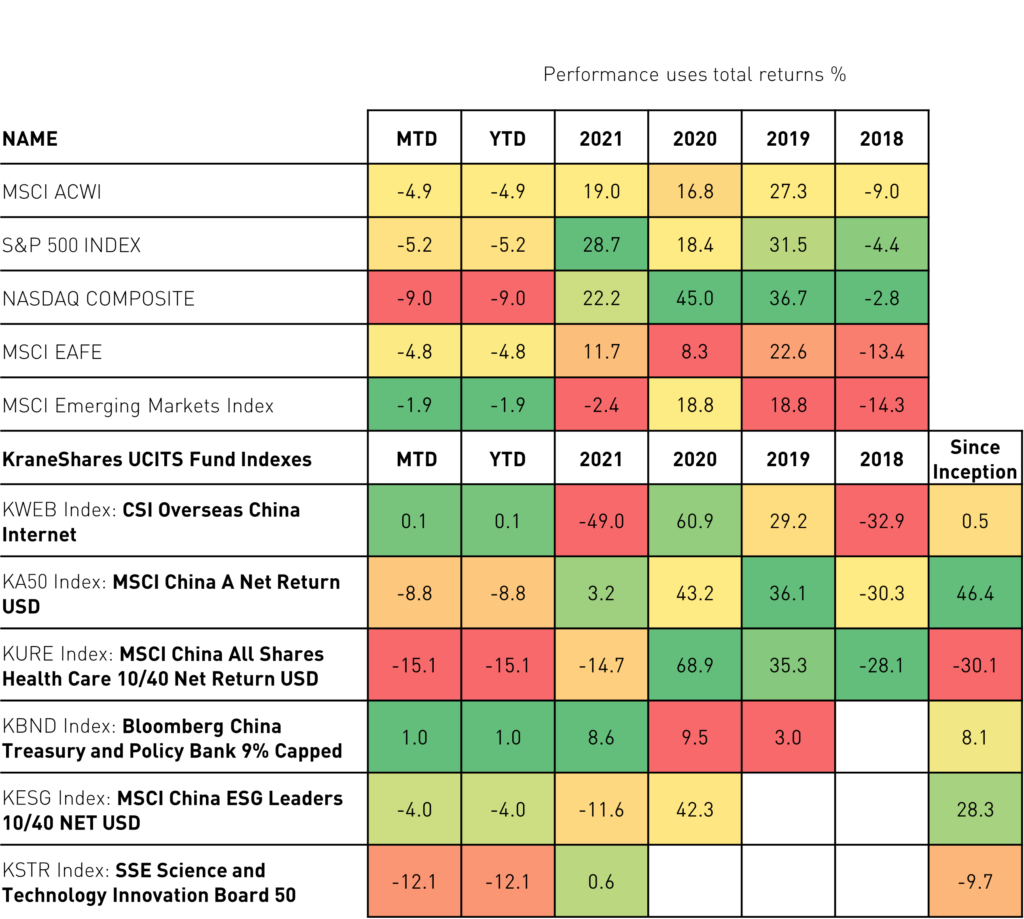
Follow the links for the most recent standard performance: KWEB LN, KA50 LN, KURE LN, KBND LN, KESG LN, KSTR LN.
Inception Dates: KWEB - 20/Nov/2018, KA50 - 26/Jun/2019, KURE - 14/Jan/2021, KBND - 26/May/2020, KESG - 03/Feb/2020, KSTR - 26/May/2021
This is a marketing communication. Please refer to the prospectus of the UCITS and to the KIID before making any final investment decisions.
Index returns are for illustrative purposes only and do not represent actual fund performance. Indexes are unmanaged and one cannot directly invest in an index.
Citations
- Data from FactSet as of Dec/31/2021.
Index Definitions
MSCI ACWI: Captures large and mid-cap representation across 23 Developed Markets (DM) and 23 Emerging Markets (EM) countries.
The S&P 500: Is an American stock market index based on the market capitalizations of 500 large companies having common stock listed on the NYSE or NASDAQ.
MSCI EAFE: is an equity index that captures large and mid-cap representation across 21 Developed Markets countries
around the world, excluding the US and Canada.
MSCI EM: captures large and mid-cap representation across 25 Emerging Markets (EM) countries.
The CSI Overseas China Internet: The CSI Overseas China Internet Index selects overseas-listed Chinese Internet companies as the index constituents; the index is weighted by free-float market cap.
MSCI China A Net Return USD: captures large and mid-cap representation across China A‐shares, B‐shares, H‐shares, Red‐chips, P‐ chips, and foreign listings (e.g. ADRs).
MSCI China All Shares Healthcare 10/40 Net Return USD: captures large and mid-cap representation across China A‐shares, B‐shares, H‐shares, Red‐chips, P‐ chips, and foreign listings (e.g. ADRs).
Bloomberg China Treasury and Policy Bank 9% Capped: seeks to track the performance of the Chinese onshore Renminbi-denominated government and government-related bank fixed-income market.
MSCI China ESG Leaders 10/40 NET USD: aims to provide exposure to companies with high Environmental, Social and
Governance (ESG) performance relative to their sector peers.
SSE Science and Technology Innovation Board 50: is comprised of the 50 largest securities listed on SSE Science and Technology Innovation Board (STAR Market) as determined by the highest market capitalization and liquidity.
r-ks