July 21, 2026 – Paolo Iurcotta Discusses China’s AI Strategy and Economic Outlook on Sky TG24 Business
July 21, 2026 – Morningstar: KraneShares China Technology ETF, One of The Best-Performing ETFs for UK Investors

July 16, 2026 – Dr. Xiaolin Chen Joins CGTN Europe to Discuss China’s Strong Trade Performance

July 2, 2026 – Dr. Xiaolin Chen Joins CGTN Europe to Discuss China’s New Outbound Investment Rules
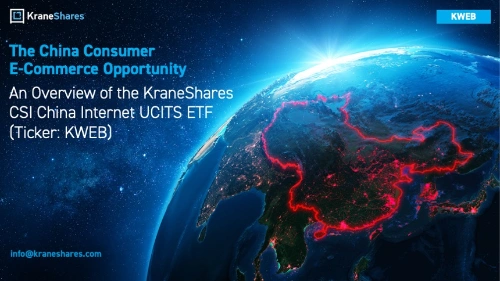
KWEB is an index-tracking, passively managed UCITS ETF that seeks to measure the performance of the investable universe of publicly traded China-based companies whose primary business or businesses are within the Internet and Internet-related sectors.
1. Data from National Bureau of Statistics of China as of 31/Dec/2025. Note: Figures converted from Chinese Renminbi to USD.
2. Data from United States Census Bureau as of 31/Dec/2025.
3. Data from China Internet Network Information Center (CNNIC) as of 31/Dec/2025.
4. Data from ITU as of 31/Dec/2025.


The Growth of USD 10,000 chart reflects an initial investment of USD 10,000 in the Fund's USD share class on the day prior to the selected time period and assumes reinvestment of dividends and capital gains. For the growth of USD 10,000 chart since inception, the initial investment of USD 10,000 is instead made on the inception date of the Fund. Fund expenses, including management fees and other expenses were deducted. The growth of a USD 10,000 investment in the fund is hypothetical and for illustration purposes only. Fund performance data used in this chart is based on Fund NAV and represents past performance. Past performance does not guarantee future results.
| Rank | Name | % of Net Assets | Ticker | Identifier | Type | Shares Held | Market Value($) | Notional Value($) | ||||||||||||||||||||||||||||||||||||||||||||||||||||||||||||||||||||||||||||||||||||||||||||||||||||||||||||||||||||||||||||||||||||||||||||||||||||||||||||||||||||||||||||||||||||||||||||||||||||||||||||||||||||||||||||||||||||||||||||||||||||||||||||||||||||||||||||||||||||||||||||||||||||||||||||||||||||||||||||||||||||||||||||||||||||||||||||||||||||||||||||||||||||||||||||||||||||||||||||||||||||||||||||||||||||||||||||||||||||||||||||||||||||||||||||||||||||||||||||||||||||||||||||||||||||||||||||||||||||||||||||||||||||||||||||||||||||||||||||||||||||||||||||||||||||||||||||||||||||||||||||||||||||||||||||||||||||||||||||||||||||||||||||||||||||||||||||||||||||||||||||||||||||||||||||||||||||||||||||||||||||||||||||||||||||||||||||||||||||||||||||||||||||||||||||||||||||||||||||||||||||||||||||||||||||||||||||||||||||||||||||||||||||||||||||||||||||||||||||||||||||||||||||||||||||||||||||||||||||||||||||||||||||||||||||||||||||||||||||||||||||||||||||||||||||||||||||||
| 1 | TENCENT HOLDINGS LTD | 9.79% | 700 | KYG875721634 | Stock | 1,236,300 | 69,837,215 | 0 | ||||||||||||||||||||||||||||||||||||||||||||||||||||||||||||||||||||||||||||||||||||||||||||||||||||||||||||||||||||||||||||||||||||||||||||||||||||||||||||||||||||||||||||||||||||||||||||||||||||||||||||||||||||||||||||||||||||||||||||||||||||||||||||||||||||||||||||||||||||||||||||||||||||||||||||||||||||||||||||||||||||||||||||||||||||||||||||||||||||||||||||||||||||||||||||||||||||||||||||||||||||||||||||||||||||||||||||||||||||||||||||||||||||||||||||||||||||||||||||||||||||||||||||||||||||||||||||||||||||||||||||||||||||||||||||||||||||||||||||||||||||||||||||||||||||||||||||||||||||||||||||||||||||||||||||||||||||||||||||||||||||||||||||||||||||||||||||||||||||||||||||||||||||||||||||||||||||||||||||||||||||||||||||||||||||||||||||||||||||||||||||||||||||||||||||||||||||||||||||||||||||||||||||||||||||||||||||||||||||||||||||||||||||||||||||||||||||||||||||||||||||||||||||||||||||||||||||||||||||||||||||||||||||||||||||||||||||||||||||||||||||||||||||||||||||||||||||||
| 2 | ALIBABA GROUP HOLDING LTD | 8.70% | 9988 | KYG017191142 | Stock | 4,381,724 | 62,019,365 | 0 | ||||||||||||||||||||||||||||||||||||||||||||||||||||||||||||||||||||||||||||||||||||||||||||||||||||||||||||||||||||||||||||||||||||||||||||||||||||||||||||||||||||||||||||||||||||||||||||||||||||||||||||||||||||||||||||||||||||||||||||||||||||||||||||||||||||||||||||||||||||||||||||||||||||||||||||||||||||||||||||||||||||||||||||||||||||||||||||||||||||||||||||||||||||||||||||||||||||||||||||||||||||||||||||||||||||||||||||||||||||||||||||||||||||||||||||||||||||||||||||||||||||||||||||||||||||||||||||||||||||||||||||||||||||||||||||||||||||||||||||||||||||||||||||||||||||||||||||||||||||||||||||||||||||||||||||||||||||||||||||||||||||||||||||||||||||||||||||||||||||||||||||||||||||||||||||||||||||||||||||||||||||||||||||||||||||||||||||||||||||||||||||||||||||||||||||||||||||||||||||||||||||||||||||||||||||||||||||||||||||||||||||||||||||||||||||||||||||||||||||||||||||||||||||||||||||||||||||||||||||||||||||||||||||||||||||||||||||||||||||||||||||||||||||||||||||||||||||||
| 3 | MEITUAN-CLASS B | 8.04% | 3690 | KYG596691041 | Stock | 5,037,600 | 57,363,343 | 0 | ||||||||||||||||||||||||||||||||||||||||||||||||||||||||||||||||||||||||||||||||||||||||||||||||||||||||||||||||||||||||||||||||||||||||||||||||||||||||||||||||||||||||||||||||||||||||||||||||||||||||||||||||||||||||||||||||||||||||||||||||||||||||||||||||||||||||||||||||||||||||||||||||||||||||||||||||||||||||||||||||||||||||||||||||||||||||||||||||||||||||||||||||||||||||||||||||||||||||||||||||||||||||||||||||||||||||||||||||||||||||||||||||||||||||||||||||||||||||||||||||||||||||||||||||||||||||||||||||||||||||||||||||||||||||||||||||||||||||||||||||||||||||||||||||||||||||||||||||||||||||||||||||||||||||||||||||||||||||||||||||||||||||||||||||||||||||||||||||||||||||||||||||||||||||||||||||||||||||||||||||||||||||||||||||||||||||||||||||||||||||||||||||||||||||||||||||||||||||||||||||||||||||||||||||||||||||||||||||||||||||||||||||||||||||||||||||||||||||||||||||||||||||||||||||||||||||||||||||||||||||||||||||||||||||||||||||||||||||||||||||||||||||||||||||||||||||||||||
| 4 | PDD HOLDINGS INC | 8.03% | PDD | US7223041028 | Stock | 674,564 | 57,236,755 | 0 | ||||||||||||||||||||||||||||||||||||||||||||||||||||||||||||||||||||||||||||||||||||||||||||||||||||||||||||||||||||||||||||||||||||||||||||||||||||||||||||||||||||||||||||||||||||||||||||||||||||||||||||||||||||||||||||||||||||||||||||||||||||||||||||||||||||||||||||||||||||||||||||||||||||||||||||||||||||||||||||||||||||||||||||||||||||||||||||||||||||||||||||||||||||||||||||||||||||||||||||||||||||||||||||||||||||||||||||||||||||||||||||||||||||||||||||||||||||||||||||||||||||||||||||||||||||||||||||||||||||||||||||||||||||||||||||||||||||||||||||||||||||||||||||||||||||||||||||||||||||||||||||||||||||||||||||||||||||||||||||||||||||||||||||||||||||||||||||||||||||||||||||||||||||||||||||||||||||||||||||||||||||||||||||||||||||||||||||||||||||||||||||||||||||||||||||||||||||||||||||||||||||||||||||||||||||||||||||||||||||||||||||||||||||||||||||||||||||||||||||||||||||||||||||||||||||||||||||||||||||||||||||||||||||||||||||||||||||||||||||||||||||||||||||||||||||||||||||||
| 5 | NETEASE INC | 5.82% | 9999 | KYG6427A1022 | Stock | 1,703,940 | 41,499,894 | 0 | ||||||||||||||||||||||||||||||||||||||||||||||||||||||||||||||||||||||||||||||||||||||||||||||||||||||||||||||||||||||||||||||||||||||||||||||||||||||||||||||||||||||||||||||||||||||||||||||||||||||||||||||||||||||||||||||||||||||||||||||||||||||||||||||||||||||||||||||||||||||||||||||||||||||||||||||||||||||||||||||||||||||||||||||||||||||||||||||||||||||||||||||||||||||||||||||||||||||||||||||||||||||||||||||||||||||||||||||||||||||||||||||||||||||||||||||||||||||||||||||||||||||||||||||||||||||||||||||||||||||||||||||||||||||||||||||||||||||||||||||||||||||||||||||||||||||||||||||||||||||||||||||||||||||||||||||||||||||||||||||||||||||||||||||||||||||||||||||||||||||||||||||||||||||||||||||||||||||||||||||||||||||||||||||||||||||||||||||||||||||||||||||||||||||||||||||||||||||||||||||||||||||||||||||||||||||||||||||||||||||||||||||||||||||||||||||||||||||||||||||||||||||||||||||||||||||||||||||||||||||||||||||||||||||||||||||||||||||||||||||||||||||||||||||||||||||||||||||
| 6 | FULL TRUCK ALLIANCE -SPN ADR | 4.26% | YMM | US35969L1089 | Stock | 3,264,593 | 30,393,361 | 0 | ||||||||||||||||||||||||||||||||||||||||||||||||||||||||||||||||||||||||||||||||||||||||||||||||||||||||||||||||||||||||||||||||||||||||||||||||||||||||||||||||||||||||||||||||||||||||||||||||||||||||||||||||||||||||||||||||||||||||||||||||||||||||||||||||||||||||||||||||||||||||||||||||||||||||||||||||||||||||||||||||||||||||||||||||||||||||||||||||||||||||||||||||||||||||||||||||||||||||||||||||||||||||||||||||||||||||||||||||||||||||||||||||||||||||||||||||||||||||||||||||||||||||||||||||||||||||||||||||||||||||||||||||||||||||||||||||||||||||||||||||||||||||||||||||||||||||||||||||||||||||||||||||||||||||||||||||||||||||||||||||||||||||||||||||||||||||||||||||||||||||||||||||||||||||||||||||||||||||||||||||||||||||||||||||||||||||||||||||||||||||||||||||||||||||||||||||||||||||||||||||||||||||||||||||||||||||||||||||||||||||||||||||||||||||||||||||||||||||||||||||||||||||||||||||||||||||||||||||||||||||||||||||||||||||||||||||||||||||||||||||||||||||||||||||||||||||||||||
| 7 | JD.COM INC-CLASS A | 4.20% | 9618 | KYG8208B1014 | Stock | 1,969,926 | 29,942,323 | 0 | ||||||||||||||||||||||||||||||||||||||||||||||||||||||||||||||||||||||||||||||||||||||||||||||||||||||||||||||||||||||||||||||||||||||||||||||||||||||||||||||||||||||||||||||||||||||||||||||||||||||||||||||||||||||||||||||||||||||||||||||||||||||||||||||||||||||||||||||||||||||||||||||||||||||||||||||||||||||||||||||||||||||||||||||||||||||||||||||||||||||||||||||||||||||||||||||||||||||||||||||||||||||||||||||||||||||||||||||||||||||||||||||||||||||||||||||||||||||||||||||||||||||||||||||||||||||||||||||||||||||||||||||||||||||||||||||||||||||||||||||||||||||||||||||||||||||||||||||||||||||||||||||||||||||||||||||||||||||||||||||||||||||||||||||||||||||||||||||||||||||||||||||||||||||||||||||||||||||||||||||||||||||||||||||||||||||||||||||||||||||||||||||||||||||||||||||||||||||||||||||||||||||||||||||||||||||||||||||||||||||||||||||||||||||||||||||||||||||||||||||||||||||||||||||||||||||||||||||||||||||||||||||||||||||||||||||||||||||||||||||||||||||||||||||||||||||||||||||
| 8 | KE HOLDINGS INC-CL A | 3.86% | 2423 | KYG5223Y1089 | Stock | 5,121,500 | 27,494,042 | 0 | ||||||||||||||||||||||||||||||||||||||||||||||||||||||||||||||||||||||||||||||||||||||||||||||||||||||||||||||||||||||||||||||||||||||||||||||||||||||||||||||||||||||||||||||||||||||||||||||||||||||||||||||||||||||||||||||||||||||||||||||||||||||||||||||||||||||||||||||||||||||||||||||||||||||||||||||||||||||||||||||||||||||||||||||||||||||||||||||||||||||||||||||||||||||||||||||||||||||||||||||||||||||||||||||||||||||||||||||||||||||||||||||||||||||||||||||||||||||||||||||||||||||||||||||||||||||||||||||||||||||||||||||||||||||||||||||||||||||||||||||||||||||||||||||||||||||||||||||||||||||||||||||||||||||||||||||||||||||||||||||||||||||||||||||||||||||||||||||||||||||||||||||||||||||||||||||||||||||||||||||||||||||||||||||||||||||||||||||||||||||||||||||||||||||||||||||||||||||||||||||||||||||||||||||||||||||||||||||||||||||||||||||||||||||||||||||||||||||||||||||||||||||||||||||||||||||||||||||||||||||||||||||||||||||||||||||||||||||||||||||||||||||||||||||||||||||||||||||
| 9 | TRIP.COM GROUP LTD | 3.80% | 9961 | KYG9066F1019 | Stock | 598,161 | 27,123,090 | 0 | ||||||||||||||||||||||||||||||||||||||||||||||||||||||||||||||||||||||||||||||||||||||||||||||||||||||||||||||||||||||||||||||||||||||||||||||||||||||||||||||||||||||||||||||||||||||||||||||||||||||||||||||||||||||||||||||||||||||||||||||||||||||||||||||||||||||||||||||||||||||||||||||||||||||||||||||||||||||||||||||||||||||||||||||||||||||||||||||||||||||||||||||||||||||||||||||||||||||||||||||||||||||||||||||||||||||||||||||||||||||||||||||||||||||||||||||||||||||||||||||||||||||||||||||||||||||||||||||||||||||||||||||||||||||||||||||||||||||||||||||||||||||||||||||||||||||||||||||||||||||||||||||||||||||||||||||||||||||||||||||||||||||||||||||||||||||||||||||||||||||||||||||||||||||||||||||||||||||||||||||||||||||||||||||||||||||||||||||||||||||||||||||||||||||||||||||||||||||||||||||||||||||||||||||||||||||||||||||||||||||||||||||||||||||||||||||||||||||||||||||||||||||||||||||||||||||||||||||||||||||||||||||||||||||||||||||||||||||||||||||||||||||||||||||||||||||||||||||
| 10 | KUAISHOU TECHNOLOGY | 3.78% | 1024 | KYG532631028 | Stock | 4,956,900 | 26,964,373 | 0 | ||||||||||||||||||||||||||||||||||||||||||||||||||||||||||||||||||||||||||||||||||||||||||||||||||||||||||||||||||||||||||||||||||||||||||||||||||||||||||||||||||||||||||||||||||||||||||||||||||||||||||||||||||||||||||||||||||||||||||||||||||||||||||||||||||||||||||||||||||||||||||||||||||||||||||||||||||||||||||||||||||||||||||||||||||||||||||||||||||||||||||||||||||||||||||||||||||||||||||||||||||||||||||||||||||||||||||||||||||||||||||||||||||||||||||||||||||||||||||||||||||||||||||||||||||||||||||||||||||||||||||||||||||||||||||||||||||||||||||||||||||||||||||||||||||||||||||||||||||||||||||||||||||||||||||||||||||||||||||||||||||||||||||||||||||||||||||||||||||||||||||||||||||||||||||||||||||||||||||||||||||||||||||||||||||||||||||||||||||||||||||||||||||||||||||||||||||||||||||||||||||||||||||||||||||||||||||||||||||||||||||||||||||||||||||||||||||||||||||||||||||||||||||||||||||||||||||||||||||||||||||||||||||||||||||||||||||||||||||||||||||||||||||||||||||||||||||||||
Holdings are subject to change.
| Name | Ticker | Listed Location | % of Net Assets | Combined % of Net Assets |
| ALIBABA GRP-ADR | BABA | United States | 0.00% | 8.70% |
| ALIBABA GROUP HOLDING LTD | 9988 | Hong Kong | 8.70% | |
| NETEASE INC-ADR | NTES | United States | 0.00% | 5.82% |
| NETEASE INC | 9999 | Hong Kong | 5.82% | |
| JD.COM INC-ADR | JD | United States | 0.00% | 4.20% |
| JD.COM INC-CLASS A | 9618 | Hong Kong | 4.20% | |
| TRIP.COM GROUP LTD-ADR | TCOM | United States | 0.00% | 3.80% |
| TRIP.COM GROUP LTD | 9961 | Hong Kong | 3.80% | |
| BAIDU INC - SPON ADR | BIDU | United States | 0.00% | 3.60% |
| BAIDU INC-CLASS A | 9888 | Hong Kong | 3.60% | |
| BILIBILI INC-ADR | BILI | United States | 0.00% | 3.49% |
| BILIBILI INC-CLASS Z | 9626 | Hong Kong | 3.49% | |
| Many US-listed Chinese companies also have listings in Hong Kong, called "secondary listings". KWEB seeks to provide investors with optimal exposure to the US and Hong Kong listed versions of these securities. In the table above, we display the individual and combined impact of US and secondary listings on the Fund. | ||||
| Exchange | Ticker | Currency | Listing Date | SEDOL | ISIN |
| London Stock Exchange | KWEB LN | USD | 21/Nov/2018 | BGLRQN6 | IE00BFXR7892 |
| Euronext Amsterdam | KWEB NA | USD | 20/May/2019 | BFYWCC2 | IE00BFXR7892 |
| London Stock Exchange | KWBE LN | EUR | 01/Oct/2020 | BGLRQP8 | IE00BFXR7900 |
| London Stock Exchange | KWBP LN | GBP | 01/Oct/2020 | BLC9NZ7 | IE00BMW13836 |
| Borsa Italiana | KWBE IM | EUR | 08/Jan/2021 | BNRQLF3 | IE00BFXR7900 |
| Deutsche Börse | KWBE GY | EUR | 10/Oct/2023 | — | IE00BFXR7892 |
| London Stock Exchange | KWBI LN | USD | 09/Mar/2026 | BWPLGP8 | IE0009ZB3ZX2 |
Each share class is offered in the base currency noted above. To the extent the fund holds exposure to any positions in a currency different to the base currency, that position is unhedged.
Hyperlinks on this website are provided as a convenience and we disclaim any responsibility for information, services or products found on the websites linked hereto.
Click here to continuePlease select your region and investor type to enter the site:
United Kingdom
 Denmark
 Finland
 France
 Germany
 Ireland
 Italy
Italy
 Luxembourg
 Netherlands
 Norway
 Portugal
 Spain
Spain
 Sweden
 Switzerland
United Kingdom
Switzerland
United Kingdom
I manage my own money
I consult with, or represent, organisations, beneficiaries or institutions
To start your visit, you have read and accepted our terms and conditions (“Terms”):
Our corporate website www.KraneShares.eu (referred to as the “website”) is owned by KraneShares. By accessing and using the website you agree to be bound by all terms and conditions which are set out on the website from time to time, which govern such access and use (the “Terms and Conditions”).
Nothing on this website is advice on the merits of any product or investment, nothing constitutes investment, legal, tax or any other advice nor is it to be relied on in making an investment decision. Prospective investors should obtain independent investment advice and inform themselves as to applicable legal requirements, exchange control regulations and taxes in their jurisdiction. This website is for information only. It is not an invitation to buy or sell an investment. It does not provide investment, tax or legal advice or recommendations and is not intended to be independent investment research.
Distribution of Information:
The distribution of the information and material on this website may be restricted by law in certain countries. None of the information is directed at, or is intended for distribution to, or use by, any person or entity in any jurisdiction (by virtue of nationality, place of residence, domicile or registered office) where publication, distribution or use of such information would be contrary to local law or regulation, or would subject KraneShares or any funds it markets to any registration or licensing requirements in such jurisdiction.
You must inform yourself about, and observe any such restrictions in your jurisdiction and by accessing the website applicable to you. The information on this website is not for distribution and does not constitute an offer to sell or the solicitation of any offer to buy any securities in the United States to or for the benefit of any United States person (being residents of the United States or partnerships or corporations organised under the laws thereof). The funds on this Website have not been registered in the United States under the Investment Company Act of 1940 and interests therein are not registered in the United States under the Securities Act of 1933.
Liability & Indemnity:
KraneShares is not responsible for the accuracy, completeness or reliability of any data, statistics, commentary or content in any media format on www.KraneShares.eu. KraneShares will not be held responsible for any financial losses incurred as a result of believing the content of materials on this website; or materials and content linked to from this website. Investors should read the Prospectus, KID or KIID as applicable and take independent legal, tax and investment advice before investing in any fund.
If you do not comply with the Terms and Conditions of this website, you may not hold KraneShares responsible for any liabilities, losses or damages derived from use of this website.
Specific risk warnings are set out in the prospectus and if applicable the supplement for the relevant product.
Website User Categorisation:
ONLY APPLICABLE IF YOU ARE AN INSTITUTIONAL INVESTOR
By entering the institutional investor section of the website, you affirm either that you are a Per Se Professional Client, or that you wish to be treated as an Elective Professional Client, both as defined under the Markets in Financial Instruments Directive, or a Qualified Investor as defined under the Prospectus Regulation, Regulation (EU) 2017/1129 or an equivalent in a jurisdiction outside the EEA (e.g. the equivalent term In Switzerland, the equivalent term is Professional Client or Institutional Client according to the Federal Act on Financial Services) (“Institutional Investor”) and you have read, understood and accepted the Terms and Conditions. The institutional investor section of the website is not intended for retail or private investors.
In accessing the website as an Institutional Investor you will be undertaking, warranting and representing to KraneShares that you are an Institutional Investor. Please note that KraneShares will be acting in reliance upon your undertaking, warranty and representation and you shall indemnify us and hold us harmless against all claims liabilities, losses, damages, costs and expenses incurred or suffered by us by reason of any breach of such undertaking, warranty and representation.
As a matter of general policy, KraneShares will not conduct regulated investment activities with any person as a result of their receiving information from the website, unless agreed otherwise with an Institutional Investor.
Disclaimer:
To find out more about how personal data is collected on our websites, please see our Privacy Policy and Notice at Collection.
Edit your location and investor type below
United Kingdom
Denmark
Finland
France
Germany
Ireland
Italy
Luxembourg
Netherlands
Norway
Portugal
Spain
Sweden
Switzerland
United Kingdom
I manage my own money
I consult with, or represent, organisations, beneficiaries or institutions
You are now leaving KraneShares.com. Hyperlinks on these websites are provided as a convenience and we disclaim any responsibility for information, services or products found on the websites linked hereto.