

Risk Rotation From Policy to Geopolitical in February

February Market Key Highlight
I remember noting down a list of economic indicators to watch for in March at the end of January’s recap. The top of which was Fed movement, specifically the Fed halting its net-asset-purchases and raising rates. The list stayed valid through February 25th, then the Russia-Ukraine crisis broke out, and I had to create a whole new watch list.
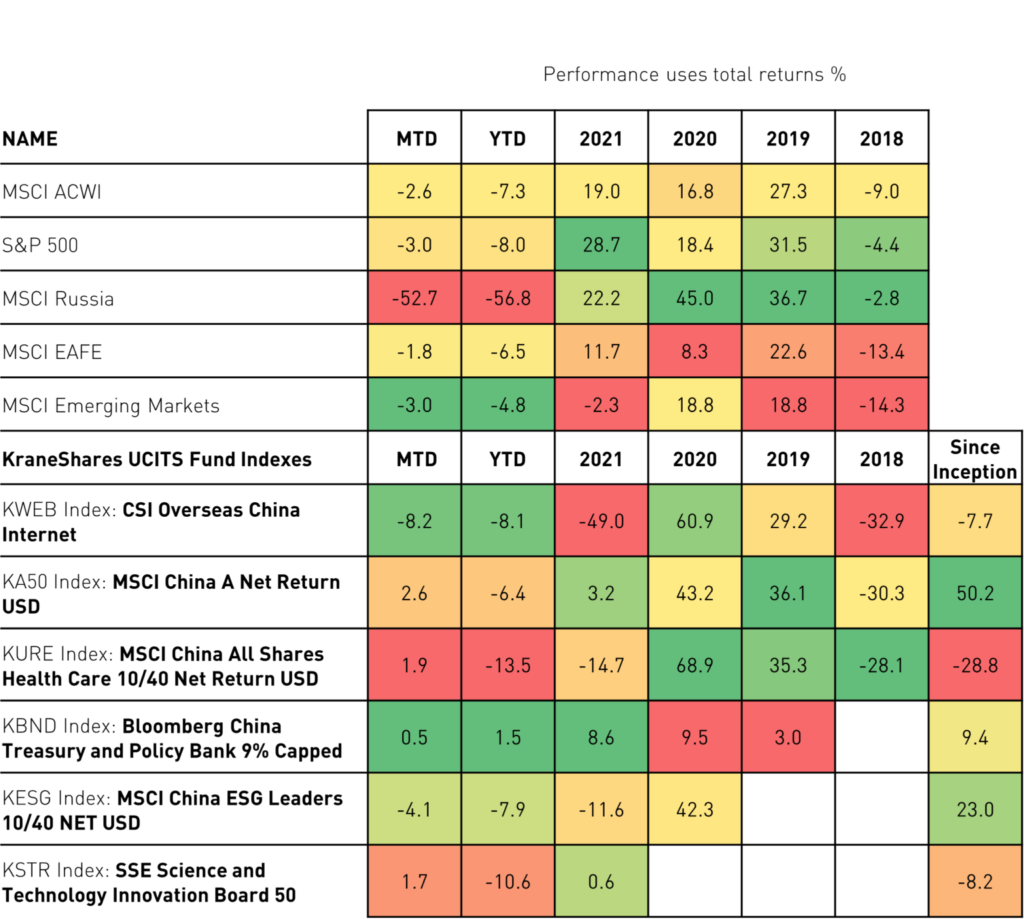
The geopolotical fear led to a global equity market selloff. The scale of the pullback resulted in breaking through some key technical levels and bringing the potential threat of the market entering correction territory. In February, MSCI ACWI returned -2.6% Month-to-Date (MTD), -7.3% Year-to-Date (YTD), SPX -3% MTD (-8% YTD), EAFE -1.8% MTD (-6.5% YTD), MSCI EM -3% MTD (-4.8% YTD) and MSCI Russia -52.7% MTD (-56.8% YTD).1 They are not without bright spots; the industries with high domestic business exposure acted more defensively, noticeable, Russell 2000 returned +1.1% MTD, and Shanghai Composite SHCOMP returned +3% MTD.1
Over the last 30 years, there were probably ten key geopolitical events that caused other pullbacks for different regional markets. We observed that China, particularly China A-Share equity, tends to be more defensive when geopolitical risk is heightened. This time around, China, like all the other equity markets, is unlikely to be immune to the volatility. Still, the scale of the selloff will be relatively less compared to other markets for three reasons:
First, China has a distinctive nature in policymaking, and the Chinese policymakers have not exhausted or fully utilized their available tools to support the country’s growth. With the under-leveraged banking liquidity, last year’s underspent government budget, and trillions of dollars in reserves on hand are all the options that policymakers can easily tap into to inject into the market if needed.
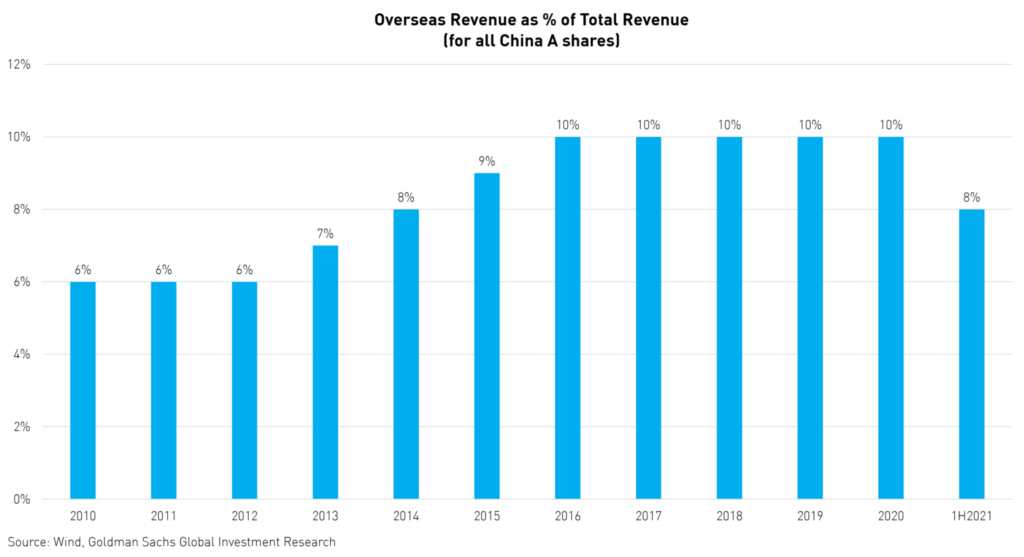
Second, Chinese companies have a domestic-focused business model and are typically fueled by millions of customers in Mainland China; revenues generated from overseas are in the single digits around 6-8%, according to Wind data.
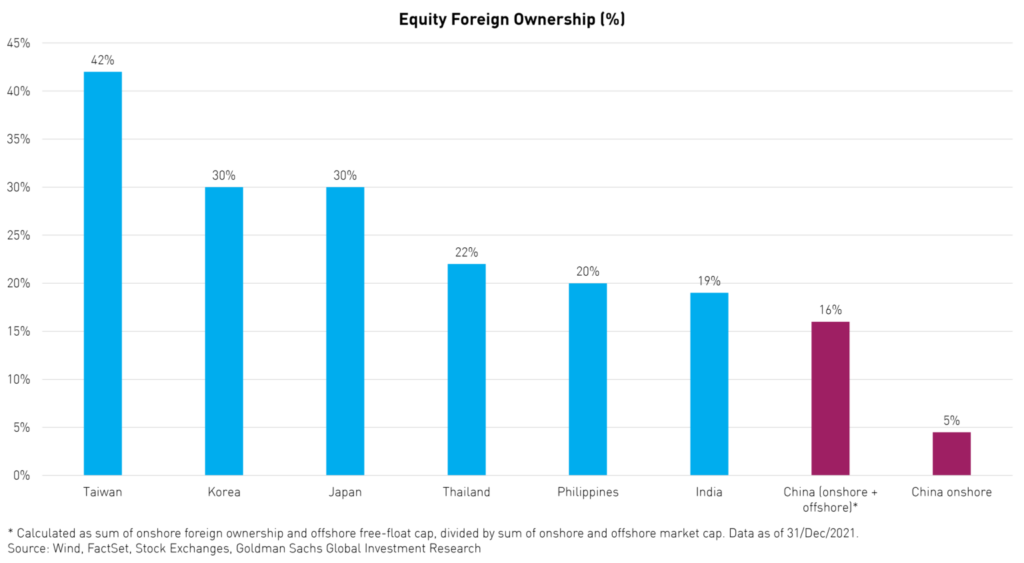
Third, the risk-off appetite is unlikely to result in any sizeable outflows from China equity as foreign ownership is still at a low level, around 4.5%, as published by Wind. Global portfolios are still underweighting China by approximately 450bps vs. the benchmark according to EPFR. The combination provides the reassurance of meaningful retrieval of capital from China’s Equity market is unlikely.
Historically the return correlations between China A-Shares and global equity markets are low, suggesting a lower spill-over impact from a global selloff. But that doesn’t mean not acknowledging potential volatility with China equity.
- Currently, most countries are starting to relax from covid lockdowns and resuming full speed into growth mode. However, heightened inflation risk and interest rate uncertainty could lead to a tightened financial condition globally. In that context, China will not be isolated from the challenge, though the degree of the impact may turn out to be a low-beta scenario.
- Even if commodity prices continue to rise, the impact on China’s inflation is limited as China’s CPI basket is dominated by food components, and China’s imports on that are restricted.
- Domestically in China, the cross-sector return correlations have reached high levels, suggesting macro factors are driving stock returns. This may continue, in our opinion, but it will shift to be on the supportive side. That makes the NPC meeting happening in Beijing an increasingly important event to watch to assess macro conditions in China for 2022
A Peek at the NPC
Starting March 4th/5th, China kicks off its dual sessions in Beijing, the Chinese People’s Political Consultative Committee (CPPCC), and the National People’s Congress (NPC), which last 7-10 days. The NPC is the crucial government meeting. In theory, it is the venue to endorse economic targets and release policy directions and objectives. At the opening of the NPC, Premier Li announced various economic targets and provided an overview of the 16,000-word Government Work Report. What we have learned thus far includes:
- 2022 GDP Growth target 5.5% higher than market expectation and maintain inflation target at 3%
- Create 11 million new urban jobs and manage the unemployment rate of 5.5%.
- Reiteration of pro-growth monetary policy similarly to 2021 and consistent with recent PBOC communications in January.
- Healthy fiscal budgeting and a stable currency.
- Stability was mentioned 76 times in the Work Report.
The geopolitical and policy events could dominate the headlines for some time. Investors are staying cautious while the market is pricing in uncertainty. The downside surprise from the current level is limited, given the pullback experienced so far.
Overseas markets only account for 8% of Chinese companies’ revenue in the listed universe.
Foreign investors’ aggregate exposure to Chinese stocks, notably A shares, remains low.
Global Indices Returns at a Glance (as of 28-Feb-2022):
Index returns are for illustrative purposes only and do not represent actual fund performance. Indexes are unmanaged and one cannot directly invest in an index.
Follow the links for the most recent standard performance: KWEB LN, KA50 LN, KURE LN, KBND LN, KESG LN, KSTR LN.
Inception Dates: KWEB - 20/Nov/2018, KA50 - 26/Jun/2019, KURE - 14/Jan/2021, KBND - 26/May/2020, KESG - 03/Feb/2020, KSTR - 26/May/2021
This is a marketing communication. Please refer to the prospectus of the UCITS and to the KIID before making any final investment decisions.
Citation
- Data from Bloomberg as of 28/Feb/2022.
Definitions
Month-to-Date (MTD): a period starting at the beginning of the current calendar month and ending at the current date.
Year-to-Date (YTD): the period of time beginning the first day of the current calendar year or fiscal year up to the current date.
Index Definitions
MSCI ACWI: Captures large and mid-cap representation across 23 Developed Markets (DM) and 23 Emerging Markets (EM) countries.
The S&P 500: Is an American stock market index based on the market capitalizations of 500 large companies having common stock listed on the NYSE or NASDAQ.
MSCI Russia: is designed to measure the performance of the large and mid cap segments of the Russian market.
MSCI EAFE: is an equity index that captures large and mid-cap representation across 21 Developed Markets countries
around the world, excluding the US and Canada.
MSCI EM: captures large and mid-cap representation across 25 Emerging Markets (EM) countries.
The CSI Overseas China Internet: The CSI Overseas China Internet Index selects overseas-listed Chinese Internet companies as the index constituents; the index is weighted by free-float market cap.
MSCI China A Net Return USD: captures large and mid-cap representation across China A‐shares, B‐shares, H‐shares, Red‐chips, P‐ chips, and foreign listings (e.g. ADRs).
MSCI China All Shares Healthcare 10/40 Net Return USD: captures large and mid-cap representation across China A‐shares, B‐shares, H‐shares, Red‐chips, P‐ chips, and foreign listings (e.g. ADRs).
Bloomberg China Treasury and Policy Bank 9% Capped: seeks to track the performance of the Chinese onshore Renminbi-denominated government and government-related bank fixed-income market.
MSCI China ESG Leaders 10/40 NET USD: aims to provide exposure to companies with high Environmental, Social and
Governance (ESG) performance relative to their sector peers.
SSE Science and Technology Innovation Board 50: is comprised of the 50 largest securities listed on SSE Science and Technology Innovation Board (STAR Market) as determined by the highest market capitalization and liquidity.
r-eu-ks