


2020: The Year of The China / EM Comeback

Summary
- In 2019, China A-shares outperformed the S&P 500, the first US-China trade resolution was reached, and MSCI's inclusion of A-Shares in the MSCI Emerging Markets Index progressed as the inclusion factor quadrupled from 5% to 20%.
- We believe many of the catalysts that powered China's equity markets in 2019 may continue in 2020. The Chinese consumer finished off 2019 stronger than anticipated and should continue to fuel growth in Mainland equity markets throughout 2020 as cyclicals rebound following progress on trade.
- Emerging Markets may benefit from trade de-escalation, potential dollar depreciation, and a light political calendar relative to the US. As a result, global investors may pivot to China / Emerging Markets in search of growth opportunities.
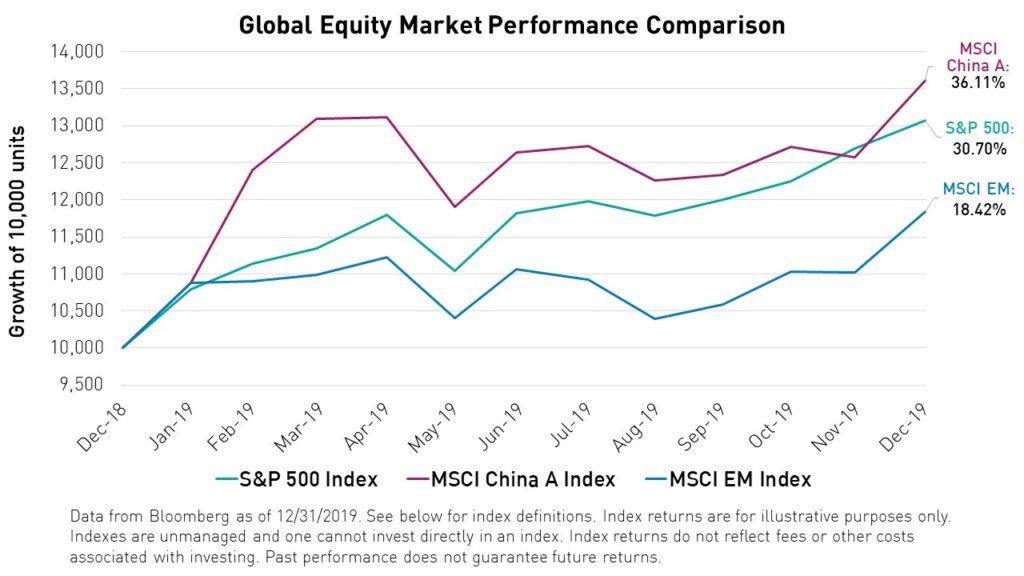
Happy New Year! As investors position themselves for the new year, we think it is helpful to look back at 2019 for clues as to where the market may be headed in 2020. Last year was noteworthy for financial markets with the S&P 500 hitting all-time highs even as headlines were dominated by US-China trade tensions, impeachment drama, and slowing global growth. For many investors, negative headlines obscured the fact that Mainland China, as measured by the MSCI China A Index, actually outperformed the US last year, returning 36.11% compared to the S&P 500’s return of 30.70%.1 China’s stock market has been healthier than headlines might suggest, and we believe that 2020 may prompt a serious pivot to China and broader Emerging Markets among global investors.
2019 Recap: Outperformance of China A-Shares, MSCI A Share Inclusion, and the First US-China Trade Resolution
Global equities experienced a wild ride in 2019 with uncertainty surrounding trade and Hong Kong protests injecting significant volatility into the market. However, both US and Emerging Markets were up by the end of 2019, rising by 30.70% and 18.42%, respectively.1 Mainland Chinese equities, as measured by the MSCI China A Index, outperformed both the US and emerging markets – the KraneShares MSCI China A-Share UCITS ETF (ticker: KBA) tracks the MSCI China A Index. This index's outperformance was likely due to Mainland Chinese stimulus to counteract the negative impact of tariffs taking effect paired with the undaunted growth of the Chinese consumer.
Many Mainland Chinese companies conduct the bulk of their business within China itself, which means that import tariffs imposed by the United States have little to no effect on their revenues. For example, China’s top alcohol brand, Kweichow Moutai, detailed in its latest Q3 financial report that it had 2,401 distributors within China versus just 106 distributors outside of China.2 Although US tariffs on steel and aluminum have negatively affected the global alcohol industry, Kweichow Moutai’s stock rose by nearly 100% in 2019.3
Investment strategies linked to legacy China benchmarks still remain widely popular today, even though their constituents are largely determined based on access restrictions that were removed over 5 years ago. As a result, many are overexposed to Hong Kong-listed stocks, meaning that many “China” funds lacked allocations to one of the best performing stock markets globally in 2019, the Mainland Chinese market. The MSCI China Index and the FTSE China 50 Index, two of the most widely tracked China benchmarks, contain 11.5% and 0% Mainland Chinese A-Shares, respectively.3
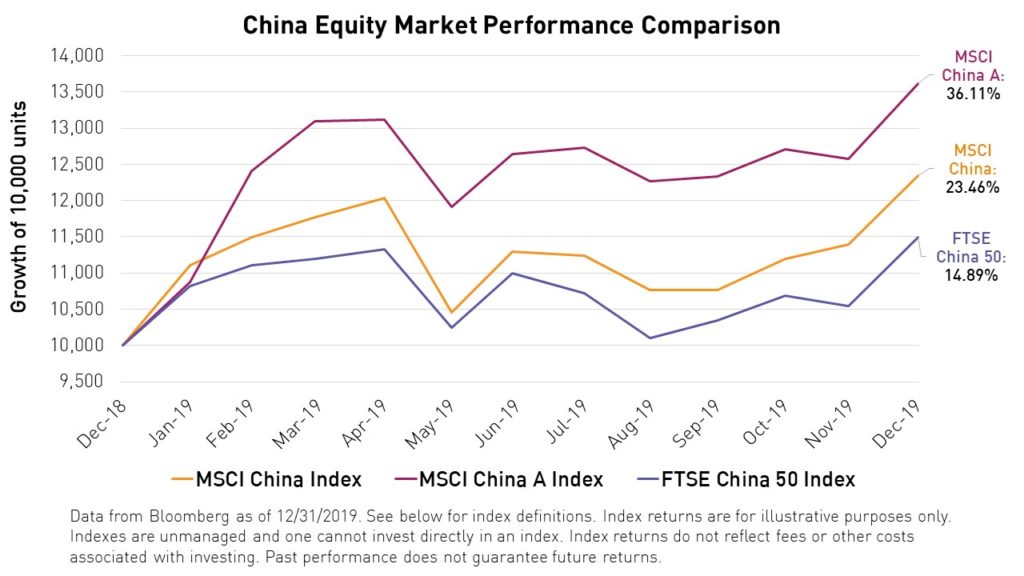
We believe the MSCI China All Shares Index, which contains 40% Mainland Chinese A-shares, presents a more accurate definition of the market.

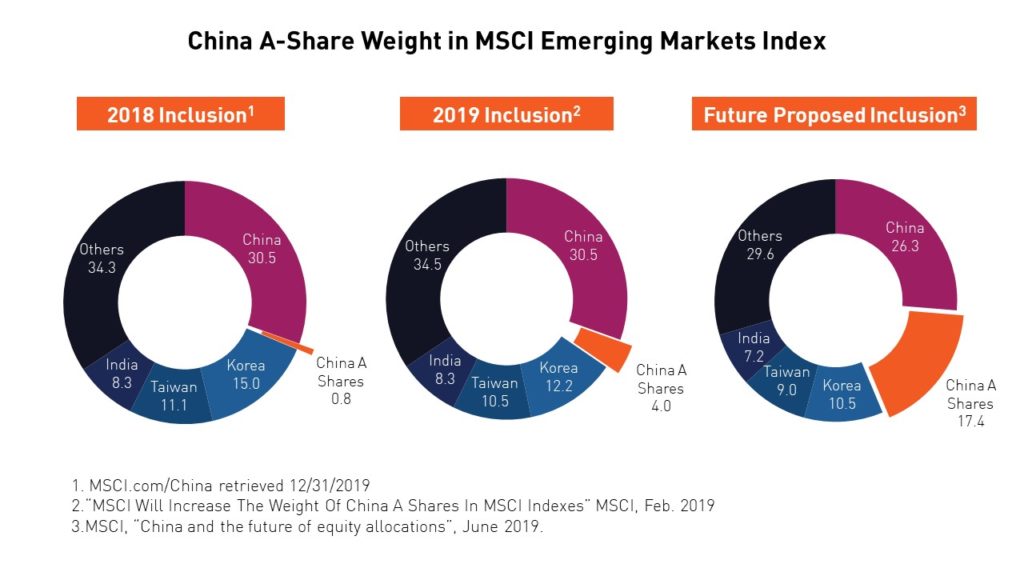
In November, MSCI also completed the third step of its weight increase of China A-shares in the MSCI Emerging Market Index, which is tracked by $1.8 trillion in AUM from across the globe. MSCI increased its inclusion factor from 5% in 2018 to 20% in 2019, meaning that the inclusion process is now 20% complete. MSCI projects that, upon full inclusion, the MSCI Emerging Markets Index will be composed of over 43% China stocks of which 40% will be Mainland-listed stocks.4 The inclusion could trigger significant institutional flows from both passive and active managers into the China A-Share market.
Another major highlight from 2019 was the announcement on December 13th that China and the US reached a “phase one” trade deal. China has promised to make purchases of no less than $200 billion of US goods over the next two years, including $40 billion in agricultural goods, and lower tariffs on key products including frozen pork and pharmaceuticals. In exchange, the US will lower tariffs from 15% to 7.5% on $110 billion worth of Chinese exports, while additional duties may remain.5 The storm is not over yet, but we can make out clear skies ahead. This year we believe the US-China relationship may stabilize as President Donald Trump focuses on the election and Chinese President Xi Jinping focuses on sustaining growth. We believe neither would like to see tensions rise and trade impeded further.
Additionally, we believe that the headlines tend to overlook the fact that that economic de-coupling between the US and China is mathematically impossible. There are simply not enough US workers to handle anywhere near the workload of the Chinese manufacturing labor force. There are a total of 164 million workers in the United States. By comparison, 100 million Chinese workers are employed in manufacturing alone.6
We also find it unlikely that US companies could find a viable alternative to China. US companies have already invested billions into infrastructure in China. One prime example of this trend is Tesla's $5 billion investment in a manufacturing facility in Shanghai that opened in 2019.7 China’s size advantage aside, other emerging and frontier market countries simply lack both the infrastructure and the infrastructure investment levels to move such a high volume of goods overseas for export.
Furthermore, while everyone talks about the US trade deficit with China in terms of goods, the US actually runs a surplus with the country in the services sector. The US services trade surplus with China was $40.5 billion in 2018.8 Therefore, the US would have a great deal to lose and probably very little to gain from deliberate economic de-coupling.
The US financial markets grew significantly in 2019, and so did the Mainland Chinese markets. We believe that the MSCI China A Share inclusion and continued trade negotiations will be catalysts for continued growth in 2020.
Trends to Watch in 2020
GDP Growth & Private Sector Support
Morgan Stanley predicts China’s real GDP growth rate to slow somewhat to an even 6% versus 6.1% in 2019.9 The slight slowdown can be mainly attributed to deleveraging combined with an uptick in overall inflation in the first half of 2020. 2019 saw targeted monetary easing, which we suspect will be continued in 2020. However, China International Capital Corporation (CICC) does not expect China’s central bank to pursue any major rate cuts (LPR to remain unchanged at 4.8%)10 during the first half of 2020 as it continues on a deleveraging program.
Nonetheless, the central bank may pursue further reserve requirement ratio cuts in order to fuel private sector lending. Total social financing (TSF), a measure of overall credit in the economy, has declined significantly since 2017 due to small bank deleveraging. In 2018, small banks accounted for nearly 30% of TSF growth and probably an even larger portion of risky lending.10 Increased lending to the private sector and credit stabilization have been overwhelmingly positive trends for China equities and we believe both are likely to continue in 2020.
Inflation Reversal
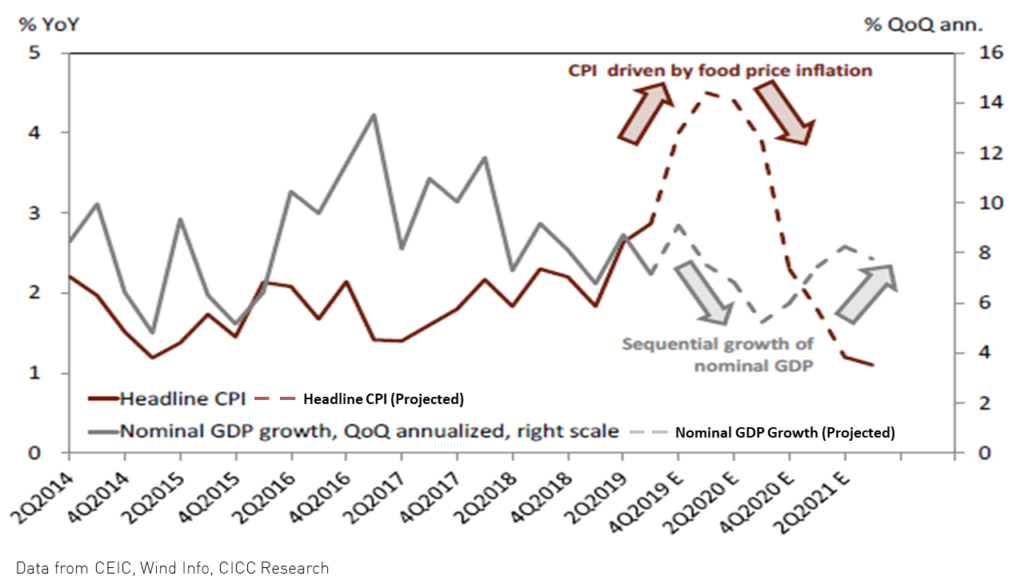
While there have been concerns that inflation could impact the purchasing power of the Chinese consumer, current rising inflation rates are primarily due to the steep rise in pork prices that occurred as a result of the swine flu outbreak. Inflation can have a negative effect on consumer-oriented businesses as consumers find they have less spending power, but, in our opinion, the risk of inflation in 2020 has been overemphasized. In fact, research suggests that the Chinese economy may see some deflation in the second half of 2020, meaning that the money in consumers’ pockets may actually be worth more at the end of the year than it was at the beginning of the year. CICC predicts an annualized average CPI inflation rate for 2020 of 3.8% compared to 2.8% in 2019.10
Chinese Consumer Healthier Than Headlines Suggest
CICC research indicates the Chinese consumer is healthier than headlines might suggest. Income tax cuts in 2019 boosted household income by an annualized 2%, but their effect should taper in 2020. However, this might not be a major issue as thus far it appears that the trade war has failed to cause systemic unemployment as the services sector is now responsible for more than twice as many jobs as the manufacturing sector.10 Also, Morgan Stanley researchers recently noted that most corporations affected by the trade war have responded with cuts to the hours that employees work rather than layoffs.9 Although the prospects for another tax cut remain uncertain, incomes may rise anyway should workers recoup the hours they lost.
Currency Stability Ahead
We believe China’s currency will remain relatively stable throughout 2020. The renminbi is projected to remain at or near 7 RMB/USD.10 Healthy foreign exchange reserves at China’s central bank and strong promotion of the domestic services economy over exports may prevent the significant depreciation of the Renminbi.
Equity Trends To Watch
Chief among headwinds for China equities in 2019 was an 8% Year over Year (YoY) decline in auto sales 11 and concerns about certain companies’ exposure to Hong Kong in terms of both financing and revenue. Uncertainty surrounding Hong Kong protests injected significant volatility into the markets and caused Mainland stocks to surge relative to their peers in Hong Kong. Hong Kong uncertainty may extend into 2020. However, supportive policy measures may power the growth of the autos sector.
2019 saw a deepening of stimulus measures as 2018’s light approach appeared insufficient. However, stimulus was targeted at firms directly impacted by the trade war and private companies. The People's Bank of China (PBOC) lowered reserve requirement ratios at major policy banks and explicitly encouraged private sector lending. This is an overwhelmingly positive development as private companies in China have historically had a difficult time securing loans compared to their state-owned peers. We believe that private sector stimulus may continue in 2020.
Consumer behavior has changed mostly because the composition of China’s consumer base has changed. 2019 saw Pinduoduo, an E-Commerce company known for being a bargain-hunter's paradise, approach the massive size of its competitor Alibaba in terms of users. This may indicate an increased involvement of residents of China’s lower-tier cities in E-Commerce and perhaps an increase in price sensitivity among China’s consumer base.
Mergers and general market concentration have been on the rise in the healthcare sector. A combination of factors led to this increase, the first of which is systematic: as many industries in China mature, mergers have become more commonplace. Also, healthcare policy is currently focused on lowering drug prices, which should benefit larger companies with economies of scale while negatively impacting smaller, more innovative players.12
We expect to see an increase in competition in the technology sector in 2020. The opening of the STAR market, a Nasdaq-style, tech-focused stock exchange, means that startups can now use equity markets for funding with far fewer regulatory hurdles to jump through. Additionally, Alibaba’s Hong Kong IPO in November should instill a fresh appetite for IPOs in Hong Kong.
We also expect cyclicals to stage a comeback in 2020. This is mostly due to the easing of trade tensions and a decline in the probability of further US tariffs. Most cyclicals in China are export-oriented companies such as chipmakers, whose revenues have been affected by the trade war.
Emerging Markets
Morgan Stanley research predicts a recovery in global GDP growth from 2.9% in the fourth quarter of 2019 to 3.4% in the fourth quarter of 2020, suggesting an average growth rate of 3.2% for 2020.9 This pickup may be largely fueled by Emerging Market economies, while Developed Market economies may continue to slow.
The near decade-long S&P rally may be jeopardized in 2020 given the market volatility implied by impeachment, the US election, and the likelihood of no new fed rate cuts in 2020. As such, investors may pivot to Emerging Markets in search of growth. In their 2020 outlook, JP Morgan advised investors to look for dividend, i.e. value, stocks, rather than growth stocks in Developed Markets, and reserve growth strategies for Emerging Markets.13
We believe the likelihood of dollar stabilization or correction also makes Emerging Markets a potentially attractive asset class for 2020. While trade and policy risks remain, the 2020 political calendar in Emerging Markets (EM) looks relatively light. Loose monetary policy should remain for most of 2020. While the fed may refrain from cutting rates during an election year, we expect some EM central banks to ease aggressively, especially those that did not in 2019.
Conclusion
We are excited about what 2020 has in store for China and Emerging Markets. The potential for easing trade tensions, lower geopolitical uncertainty, and a pickup in global growth warrant a fresh look at international markets. The potential for a dollar slump, further agreement on trade, or an even healthier pickup in global growth than expected may make a pivot to Emerging Markets and China inevitable for equity investors. The Chinese consumer finished 2019 stronger than anticipated and can continue to fuel growth in China's equity markets throughout 2020 as cyclicals may recoup losses following trade de-escalation.
Citations:
- Data from Bloomberg as of 2019/12/31.
- Kweichou Moutai 3rd Quarter 2019 Report.
- Data from Bloomberg as of 2019/12/31.
- “Consultation on further weight increase of China A shares in the MSCI Indexes,” MSCI. December, 2018.
- Brown, Chad P. “US-China Trade War Tariffs: An Up-to-Date Chart,” Peterson Institute For International Economics (PIIE). 13 December, 2019.
- Data from The World Bank as of 31 December, 2018.
- Dobush, Grace. “Why Tesla Is Investing $5 Billion in a New China Factory, Its First Outside the U.S.,” Fortune. 1 August, 2018.
- Data from The US Trade Representative as of 31 December, 2018.
- “2020 Global Macro Outlook: Calmer Waters Ahead,” Morgan Stanley Research. 13 December, 2019.
- “External uncertainties eased; domestic demand remains under pressure – China 2020 Macro Outlook,” CICC Research. November, 2019.
- Data from China Association of Automobile Manufacturers (CAAM).
- Zhang, Yidong. “China’s Long Bull Driven by ‘Core Assets’: China 2019 H2 Equity Investment Outlook,” Industrial Securities. September, 2019.
- Kelly, David. “The Outlook for 2020: Investment Strategies For A Late-Cycle Environment,” JP Morgan Asset Management.
Index Definitions:
MSCI Emerging Markets Index (MSCI EM): The MSCI Emerging Markets Index is a free-float weighted equity index that captures large and mid-cap representation across Emerging Market (EM) countries. The index covers approximately 85% of the free-float adjusted market capitalization in each country. All performance quoted is in USD. The index was launched on January 1, 2001.
S&P 500 Index: The S&P 500 Index is an American stock market index based on the market capitalization of the 500 largest companies having common stock listed on the NYSE or NASDAQ. All performance quoted is in USD. The index was launched on March 4, 1957.
FTSE China 50 Index: Investors globally use the FTSE China 50 Index to gain exposure to the Chinese market. It is a real-time tradable index comprising 50 of the largest and most liquid Chinese stocks (H Shares, Red Chips and P Chips) listed and trading on the Stock Exchange of Hong Kong (SEHK). The index is specifically designed for international investors, combining the ease of trading on SEHK with a methodology to meet fund regulatory requirements worldwide. All performance quoted is in USD. The index was launched on April 19, 2001.
MSCI China Index: The MSCI China Index captures large and mid cap representation across China H shares, B shares, Red chips, P chips and foreign listings (e.g. ADRs). With 710 constituents, the index covers about 85% of this China equity universe. Currently, the index also includes Large Cap A shares represented at 15% of their free-float adjusted market capitalization. All performance quoted is in USD. The index was launched on October 31, 1995.
MSCI China A Index: The MSCI China A Index captures large and mid-cap representation across China securities listed on the Shanghai and Shenzhen exchanges. The index covers only those securities that are accessible through "Stock Connect". The index is designed for international investors and is calculated using China A Stock Connect listings based on the offshore RMB exchange rate (CNH). All performance quoted is in USD. The index was launched on March 1, 2018.
MSCI China All Shares Index: The MSCI China All Shares Index captures large and mid-cap representation across China A‐shares, B‐shares, H‐shares, Red‐chips, P‐ chips and foreign listings (e.g. ADRs). The index aims to reflect the opportunity set of China share classes listed in Hong Kong, Shanghai, Shenzhen and outside of China. It is based on the concept of the integrated MSCI China equity universe with China A-shares included. All performance quoted is in USD. The index was launched on June 26, 2014.