April 15, 2024 – China Economic Outlook: “Solid Financial Framework Is Fundamental”

April 5, 2024 – Five Percent Growth, 12 Million Jobs Planned and A Trillion Renminbi Bond: What’s Not to Like About China?
April 2, 2024 – Bloomberg Daybreak: Europe 3/28/24
March 26, 2024 – What Message Is the China Development Forum Conveying This Year?
Our semi-monthly topical research reports. Subscribe to our weekly mailing list for more.

March 6, 2024 – China Market Connect February 2024: The Arrow Is Nocked, It Must Fly

February 15, 2024 – Charging Forward: Exploring Opportunities in Electric Vehicle Stocks Amidst Market Fluctuations

January 31, 2024 – AI & The Dragon: What Trends Will Dominate 2024?

December 11, 2023 – On The Ground With NIO: Revolutionizing the EV Industry with User-Centric Innovation & Cutting-Edge Technology
KA50 is an index-tracking, passively managed, UCITS ETF that is benchmarked to the MSCI China A 50 Connect Index, consisting of 50 large-cap Shanghai and Shenzhen listed stocks (A-shares) available through Stock Connect. A key feature of this Index is that it offers the first officially recognized Futures contracts for Stock Connect-eligible A-shares, representing a powerful risk management tool that makes its underlying stocks attractive to international investors. KA50 focuses on the largest, most liquid stocks, which receive most foreign interest and inflows and may benefit from increased global investment in China’s onshore market over the long term.
1.) Data from MSCI as of 30/Sept/2021.
@Dr_XiaolinChen joined @Bloomberg Daybreak Europe to discuss her recent meetings with high-level executives and policymakers in #China, why she believes #investment sentiment is becoming positive towards China, and key sectors presenting emerging investment opportunities.
— KraneShares (@KraneShares) April 2, 2024
Watch:… pic.twitter.com/QGUJJMkjJY
@Dr_XiaolinChen joined @CGTNEurope to discuss the key takeaways from the #ChinaDevelopmentForum2024, including the trillions of renminbi in bond issuance, how it follows up this year's National People's Congress (#NPC), and more.
— KraneShares (@KraneShares) March 26, 2024
Watch: https://t.co/0cVzKWfrtg#China #investing… pic.twitter.com/cJQyT0cRQ3


The Growth of USD 10,000 chart reflects an initial investment of USD 10,000 in the Fund's USD share class on the day prior to the selected time period and assumes reinvestment of dividends and capital gains. For the growth of USD 10,000 chart since inception, the initial investment of USD 10,000 is instead made on the inception date of the Fund. Fund expenses, including management fees and other expenses were deducted. The growth of a USD 10,000 investment in the fund is hypothetical and for illustration purposes only. Fund performance data used in this chart is based on Fund NAV and represents past performance. Past performance does not guarantee future results.
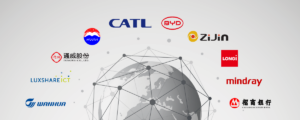
| Rank | Name | % of Net Assets | Ticker | Identifier | Shares Held | Market Value($) |
| 1 | CONTEMPORARY A-A | 7.69% | 300750 | CNE100003662 | 6,080 | 165,062 |
| 2 | KWEICHOW MOUTAI CO LTD-A | 7.51% | 600519 | CNE0000018R8 | 700 | 161,271 |
| 3 | ZIJIN MINING-A | 7.30% | 601899 | CNE100000B24 | 61,700 | 156,850 |
| 4 | FOXCONN INDUST-A | 5.42% | 601138 | CNE1000031P3 | 38,000 | 116,382 |
| 5 | WANHUA CHEMIC-A | 5.30% | 600309 | CNE0000016J9 | 9,400 | 113,914 |
| 6 | LUXSHARE PRECI-A | 3.66% | 002475 | CNE100000TP3 | 20,540 | 78,634 |
| 7 | CHINA MERCHANTS BANK-A | 3.49% | 600036 | CNE000001B33 | 16,593 | 75,018 |
| 8 | BYD CO LTD -A | 3.42% | 002594 | CNE100001526 | 2,498 | 73,486 |
| 9 | CHINA YANGTZE-A | 3.00% | 600900 | CNE000001G87 | 18,100 | 64,532 |
| 10 | BOE TECHNOLOGY-A | 2.92% | 000725 | CNE0000016L5 | 106,000 | 62,769 |
Holdings are subject to change.
| Exchange | Ticker | Currency | Listing Date | SEDOL | ISIN |
| London Stock Exchange | KA50 LN | USD | 27/Jun/2019 | BJ9JTF8 | IE00BJLFK515 |
| Borsa Italiana | KA50 IM | EUR | 13/Oct/2022 | — | IE00BJLFK515 |
| Deutsche Börse Xetra | KBA | EUR | 10/Oct/2023 | — | IE00BJLFK515 |
Each share class is offered in the base currency noted above. To the extent the fund holds exposure to any positions in a currency different to the base currency, that position is unhedged.
Hyperlinks on this website are provided as a convenience and we disclaim any responsibility for information, services or products found on the websites linked hereto.
Click here to continuePlease select your region and investor type to enter the site:
United Kingdom
 Finland
 Germany
 Ireland
 Italy
Italy
 Netherlands
 Portugal
 Spain
Spain
 Sweden
 Switzerland
United Kingdom
Switzerland
United Kingdom
I manage my own money
I consult with, or represent, organisations, beneficiaries or institutions
To start your visit, you have read and accepted our terms and conditions (“Terms”):
Our corporate website www.KraneShares.eu (referred to as the “website”) is owned by KraneShares. By accessing and using the website you agree to be bound by all terms and conditions which are set out on the website from time to time, which govern such access and use (the “Terms and Conditions”).
Nothing on this website is advice on the merits of any product or investment, nothing constitutes investment, legal, tax or any other advice nor is it to be relied on in making an investment decision. Prospective investors should obtain independent investment advice and inform themselves as to applicable legal requirements, exchange control regulations and taxes in their jurisdiction. This website is for information only. It is not an invitation to buy or sell an investment. It does not provide investment, tax or legal advice or recommendations and is not intended to be independent investment research.
Distribution of Information:
The distribution of the information and material on this website may be restricted by law in certain countries. None of the information is directed at, or is intended for distribution to, or use by, any person or entity in any jurisdiction (by virtue of nationality, place of residence, domicile or registered office) where publication, distribution or use of such information would be contrary to local law or regulation, or would subject KraneShares or any funds it markets to any registration or licensing requirements in such jurisdiction.
You must inform yourself about, and observe any such restrictions in your jurisdiction and by accessing the website applicable to you. The information on this website is not for distribution and does not constitute an offer to sell or the solicitation of any offer to buy any securities in the United States to or for the benefit of any United States person (being residents of the United States or partnerships or corporations organised under the laws thereof). The funds on this Website have not been registered in the United States under the Investment Company Act of 1940 and interests therein are not registered in the United States under the Securities Act of 1933.
Liability & Indemnity:
KraneShares is not responsible for the accuracy, completeness or reliability of any data, statistics, commentary or content in any media format on www.KraneShares.eu. KraneShares will not be held responsible for any financial losses incurred as a result of believing the content of materials on this website; or materials and content linked to from this website. Investors should read the Prospectus, KID or KIID as applicable and take independent legal, tax and investment advice before investing in any fund.
If you do not comply with the Terms and Conditions of this website, you may not hold KraneShares responsible for any liabilities, losses or damages derived from use of this website.
Specific risk warnings are set out in the prospectus and if applicable the supplement for the relevant product.
Website User Categorisation:
ONLY APPLICABLE IF YOU ARE AN INSTITUTIONAL INVESTOR
By entering the institutional investor section of the website, you affirm either that you are a Per Se Professional Client, or that you wish to be treated as an Elective Professional Client, both as defined under the Markets in Financial Instruments Directive, or a Qualified Investor as defined under the Prospectus Regulation, Regulation (EU) 2017/1129 or an equivalent in a jurisdiction outside the EEA (e.g. the equivalent term In Switzerland, the equivalent term is Professional Client or Institutional Client according to the Federal Act on Financial Services) (“Institutional Investor”) and you have read, understood and accepted the Terms and Conditions. The institutional investor section of the website is not intended for retail or private investors.
In accessing the website as an Institutional Investor you will be undertaking, warranting and representing to KraneShares that you are an Institutional Investor. Please note that KraneShares will be acting in reliance upon your undertaking, warranty and representation and you shall indemnify us and hold us harmless against all claims liabilities, losses, damages, costs and expenses incurred or suffered by us by reason of any breach of such undertaking, warranty and representation.
As a matter of general policy, KraneShares will not conduct regulated investment activities with any person as a result of their receiving information from the website, unless agreed otherwise with an Institutional Investor.
Disclaimer:
To find out more about how personal data is collected on our websites, please see our Privacy Policy.
Edit your location and investor type below
United Kingdom
Finland
Germany
Ireland
Italy
Netherlands
Portugal
Spain
Sweden
Switzerland
United Kingdom
I manage my own money
I consult with, or represent, organisations, beneficiaries or institutions
You are now leaving KraneShares.com. Hyperlinks on these websites are provided as a convenience and we disclaim any responsibility for information, services or products found on the websites linked hereto.