


China To Pull The Rest of EM Into The Spotlight
Executive Summary
- In the first quarter of 2022, a run-up in commodity prices, high inflation in developing countries, a surging US dollar, and sharply higher rates in the US caused investors to pare back exposure to emerging markets (EM) and China. Since then, commodity prices have begun to cool, and we are seeing a slowdown in the US housing and automotive markets due to higher interest rates. We believe this could help reignite risk-taking globally.
- As the dust settles, we believe investors will start focusing on fundamentals again, and EM and China will be beneficiaries.
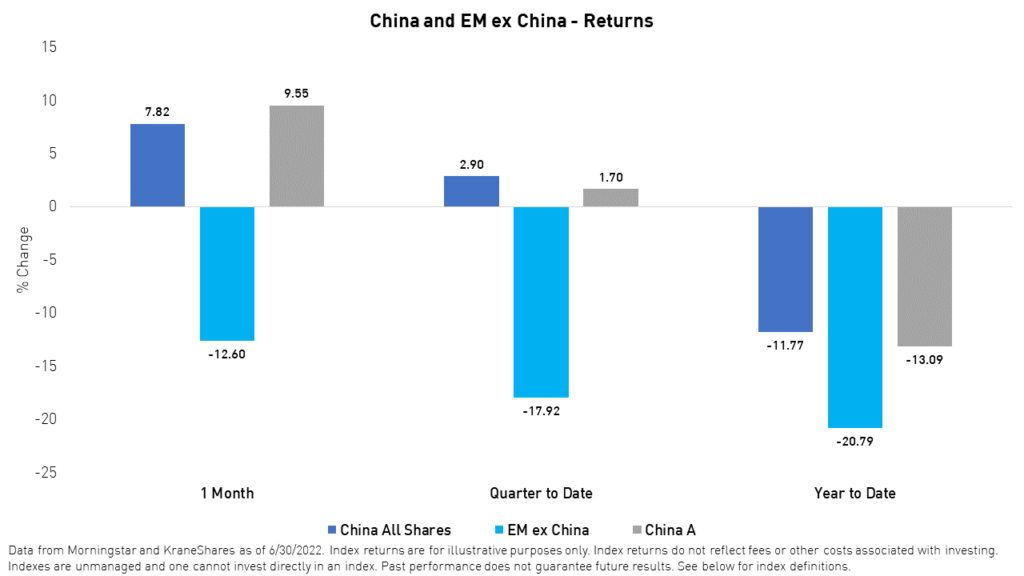
- China's Mainland markets outperformed the rest of emerging markets (EM) in the second quarter by a wide margin.1 We believe China’s outperformance should pull the rest of EM into the spotlight.
- We believe the best way to access China's Mainland market is through the KraneShares MSCI China A 50 Connect UCITS ETF (Ticker: KA50), which provides exposure to the 50 largest and most liquid securities within the MSCI China A Index.
Introduction
It has been a difficult quarter for global markets. Investors lack a clear view of what is in store for the rest of the year due to persistently high inflation prints in the US, Europe, and many emerging markets (EM). Although we are seeing the light at the end of the tunnel and what appear to be price peaks in energy and materials, many major economies are expected to tighten monetary policy further this summer.
However, China is one of the few exceptions. Inflation in the world’s second-largest economy is under control, and key rates could decline further as China’s central bank attempts to stimulate demand following strict lockdowns and meet its ambitious targets for growth.
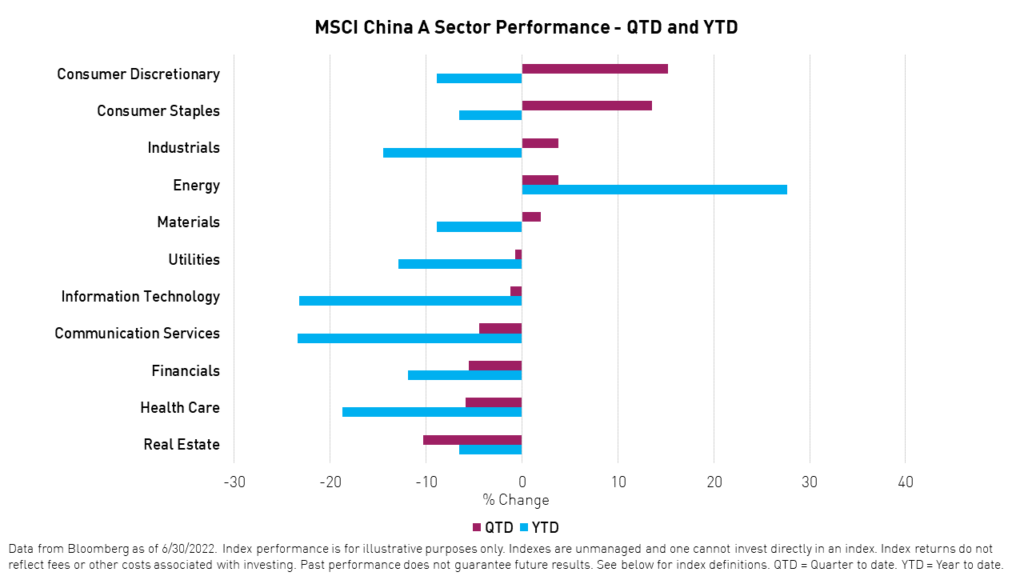
The KraneShares MSCI China A 50 Connect UCITS ETF (Ticker: KA50), which consists of 50 large-cap Shanghai and Shenzhen listed stocks (A-shares) available through Stock Connect, rose +3.5% during the second quarter and +10.85% in June versus +1.7% and +9.55% for the broader MSCI China A index. Consumer discretionary and consumer staples were the best performing sectors during the second quarter, rising +15.21% and +13.71%, respectively, as consumer plays rebounded from the lockdown-driven downdraft. Information technology and communication services declined the most. Currency attribution added ~1.7% during the second quarter, but its negative impact on the year-to-date performance (a drag of -13.2%) remains significant. The sharp increase in the yield on the US 10-year Treasury, which has risen above China’s 10-year rate for the first time in many years, has led to Renminbi depreciation versus the US dollar so far in 2022, though the Renminbi's slide versus the dollar was far less than most major currencies.1
For KA50 current standard performance, please click here. Please see below for standard performance disclosure.
The performance data quoted represents past performance. Past performance does not guarantee future results. The investment return and principal value of an investment will fluctuate such that an investor’s shares, when sold or redeemed, may be worth more or less than their original cost, and current performance may be lower or higher than the performance quoted. For performance data current to the last month-end, please visit our website at www.kraneshares.eu.
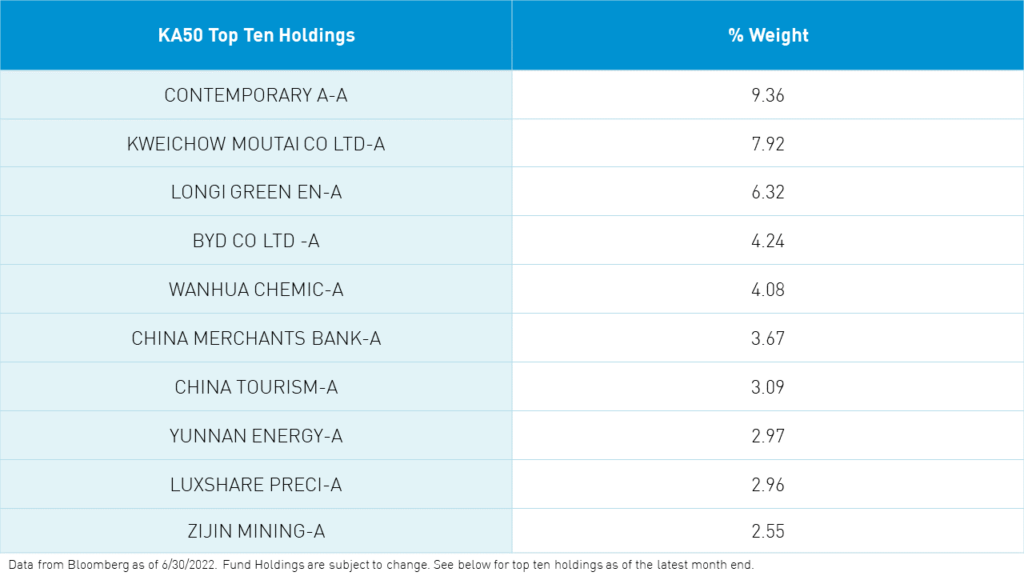
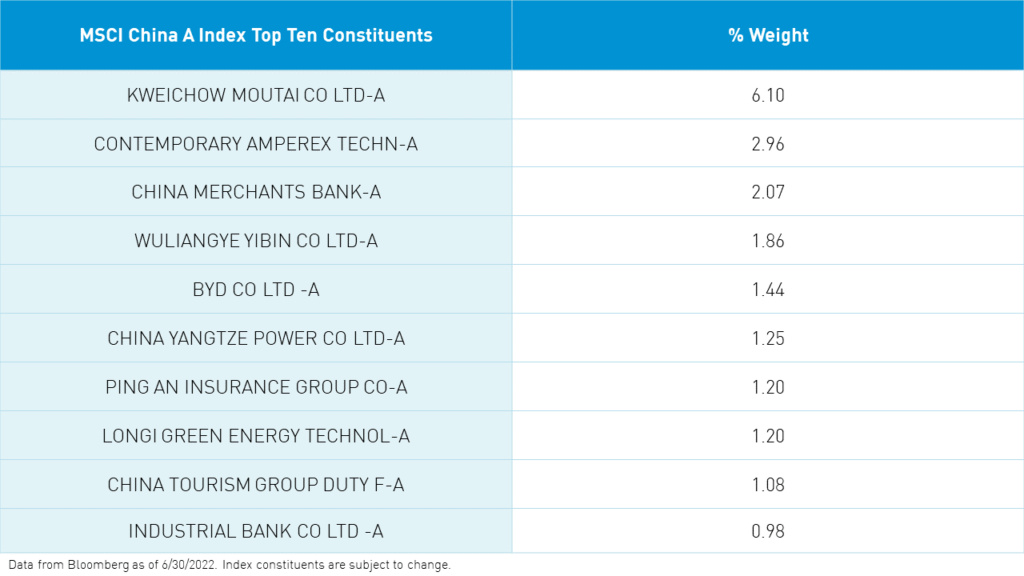
KA50 focuses on the largest, most liquid stocks, which receive the most interest from foreign investors. Inflows into these equities may benefit from future index inclusion and increased global investment in China's onshore market generally, which we believe is a long-term trend. KA50's index, the MSCI China A 50 Connect Index, is more geared toward consumer stocks than its parent index, the MSCI China A Index, which has a higher weight to energy and materials.
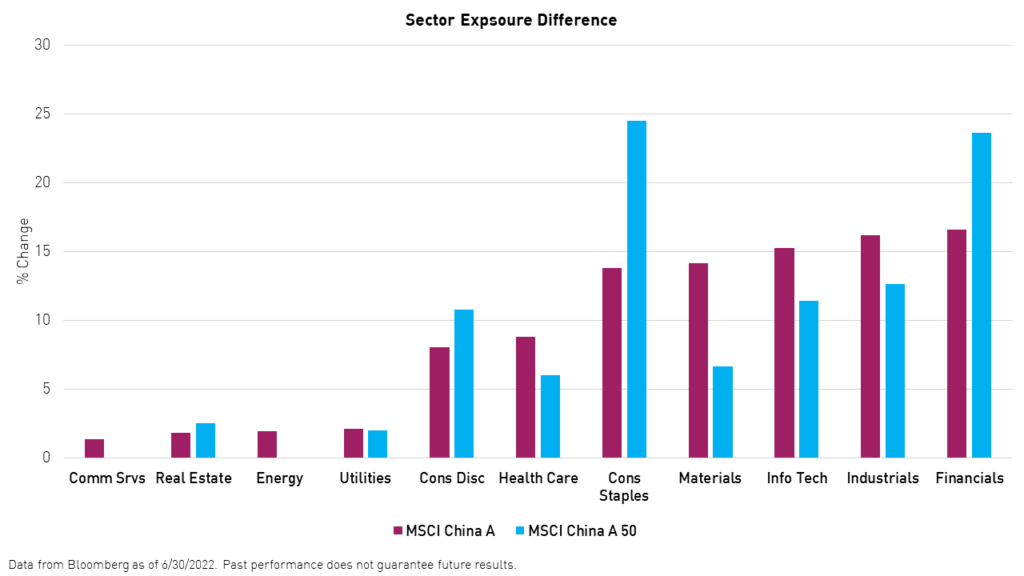
While there are many shared constituents between the two indexes, KA50 excludes Wuliangye, a liquor company, and China Industrial Bank and includes Yunnan Energy and Zijin Mining. Also, KA50 is more concentrated as the top ten holdings accounted for 47.16% of the Fund's net assets as of the end of the second quarter.
China Review
China was the only standout during the second quarter in EM, rising +2.90%, led by consumer discretionary and clean technology stocks. China’s A-shares market, which lagged during the quarter due to lockdowns and dollar strength, rebounded in June with a +9.55% return.1 Investors’ sentiment toward China improved significantly in June for multiple reasons.
First, investors seem to have more confidence that we may have seen the peak in regulations and desilting volatility as the government has taken multiple steps since Premier Liu He’s speech in March to ease concerns. They proposed a draft law in April to adjust the data privacy law and allow the US Public Company Accounting Oversight Board (PCAOB) to audit local companies.2 Central government policy recommendations to quickly rectify reforms culminated in the end of the investigation of Didi and the resumption of game approvals. Second, China’s stimulus efforts intensified during the second quarter following lockdowns as the government attempts to shore up economic growth.3 Even China’s property market began to turn around before lockdowns interrupted progress. The government has initiated multiple initiatives this year to support the battered sector. Thirdly, we believe investors are aware that dynamics are changing in the US with higher rates, high valuations, and slowing growth and are starting to look to China to meet their investment objectives for the next 3 to 5 years.
Emerging Markets ex-China Review
EM performance suffered during the second half of 2022, with only China in the green. Korea was among the hardest hit countries in Asia from an equity performance perspective, declining -20.83% during the second quarter as unrelenting inflation, higher rates, an omicron wave, China lockdowns, and a truckers’ strike combined to hit consumer confidence and investors’ sentiment severely in June. The Bank of Korea revised Q1 GDP from 3% to 2.6% in June on softer growth than initially thought in the exports and manufacturing sectors.1
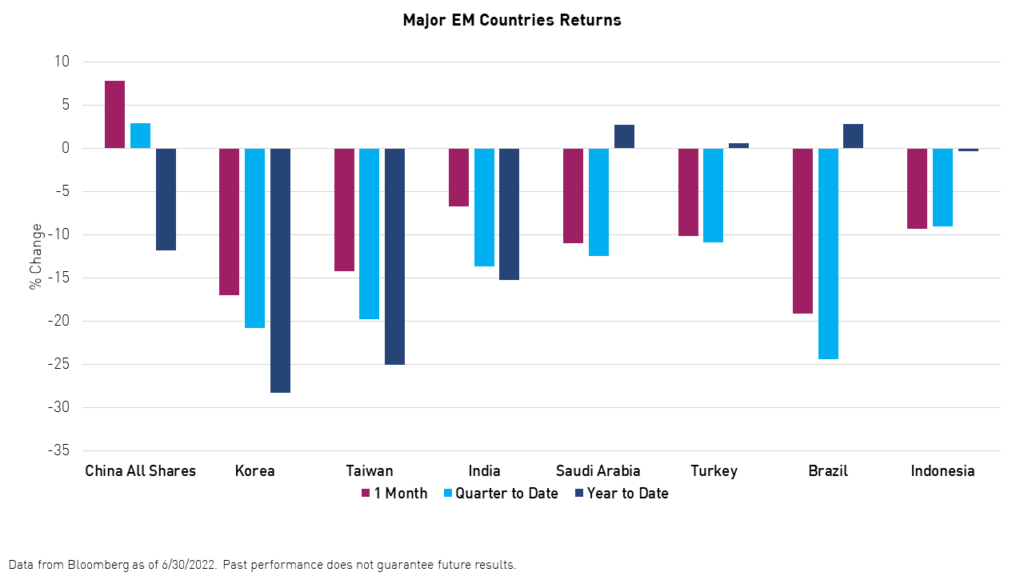
A similar situation unfolded in Taiwan as inflation, lockdowns in China, and a local COVID-19 wave hit consumer sentiment, leading to a decline of -19.81% in Q2.1
Commodity-facing economies such as Brazil, Indonesia, and Saudi Arabia retreated in June as oil and metals prices cooled.1
India continues to fare better than most EM countries, helped by strong exports and manufacturing growth. However, the impact of high oil prices appeared in the country’s record current account deficit as a percentage of GDP print in June.
Outlook
Macroeconomics
In the first quarter of 2022, a run-up in commodity prices, high inflation in developing countries, a surging US dollar, and sharply higher rates in the US caused investors to pare back exposure to EM and China. Since then, commodity prices have begun to cool. Furthermore, we are seeing signs of a slowdown in the US housing and automotive markets due to higher rates. We believe this could help reignite risk-taking globally. The yield on the US 10-year Treasury has retreated from a peak of 3.5% on June 14, 2022, to 2.7% on August 4, 2022.1 As the dust settles, we believe investors may start to focus on fundamentals once again, and EM and China will be beneficiaries. We are starting to see investors position themselves for the future rather than react to the present.
China / China A
China’s growth should recover in the second half of the year from the impact of the lockdowns. While revenue growth for Chinese companies may come below the long-term trend, we believe earnings growth will remain robust as companies continue to cut costs and bad investments. We believe low valuations, low positioning, and the end of the regulatory cycle in China will continue to attract investors as growth recovers. COVID outbreaks remain the main risk for China. With the elections nearing, we believe China may have to pivot from a Zero COVID policy, especially if it proves to be a continued impediment to economic growth. In June, the central government released new guidelines for disease prevention intended to reduce the economic toll of any future lockdowns. For more on this, please read our latest China Internet Earnings Report.
Investors seem to have turned positive on China’s A-shares after a year and a half hiatus. We believe China’s mainland market is home to some of China’s most lucrative and innovative sectors, including food and beverage, home appliances, healthcare, cleantech, 5G, high-end manufacturing, and more. In addition to its long-term growth potential as China transitions to the new economy, the A-shares market is opening up. It could potentially receive significant flows from foreign and domestic investors. In June, the government proposed a draft law to allow pension funds to invest in the market. Also, as China continues to confirm that “housing is for living, not for speculation,” we expect domestic flows to be redirected to the stock market. We believe the long-term story for China and emerging markets has not changed fundamentally but was rather interrupted by the pandemic, war, and regulations, among other issues.
EM ex-China
As for the rest of the emerging markets, negative consumer and investor sentiment may be bottoming, especially in Korea and Taiwan. We expect economic activity to pick up as China reopens more fully and inflation eases. We still expect both Korea and Taiwan to tighten in the near term. The decline in commodity prices should be a relief and help tame inflation. India is showing signs of a slowdown in its export and manufacturing sectors, both of which have been a bright spot this year. However, the decline in oil prices and inflation should help revive the growth of the consumer, India’s foremost long-term growth driver.
This is a marketing communication. Please refer to the prospectus of the UCITS and to the KIID before making any final investment decisions.
Citations:
- Data from Bloomberg as of 6/30/2022.
- "China Removes Key Hurdle to Allow U.S. Full Access to Audits," Bloomberg News. April 2, 2022.
- "China's Credit Flow Jumps as Government Boosts Economic Stimulus," Bloomberg News. July 11, 2022.
KA50 Top Ten Holdings as of 7/29/2022:
- CONTEMPORARY A-A 9.63%
- KWEICHOW MOUTAI CO LTD-A 8.33%
- LONGI GREEN EN-A 6.58
- BYD CO LTD -A 4.41%
- WANHUA CHEMIC-A 3.8%
- LUXSHARE PRECI-A 3.35%
- CHINA MERCHANTS BANK-A 3.33%
- CHINA TOURISM-A 3.05%
- YUNNAN ENERGY-A 2.74%
- ZIJIN MINING-A 2.69%
Definitions:
MSCI Emerging Markets (EM) Index: The MSCI Emerging Markets Index is a free-float weighted equity index that captures large and mid-cap representation across Emerging Market (EM) countries. The index covers approximately 85% of each country’s free-float adjusted market capitalization. The index was launched on January 1, 2001.
MSCI Korea Index (referred to as Korea herein): Inception Date: March 31, 1989. The MSCI Korea Index is designed to measure the performance of the large and mid-cap segments of the South Korean market. The index covers about 85% of the Korean equity universe.
MSCI Taiwan Index (referred to as Taiwan herein): Inception Date: July 31, 1989. The MSCI Taiwan Index is designed to measure the performance of the large and mid-cap segments of the Taiwan market. The index covers about 85% of Taiwan’s free float-adjusted market capitalization.
MSCI India Index (referred to as India herein): Inception Date: April 30, 1993. The MSCI India Index is designed to measure the performance of the large and mid-cap segments of the Indian market. The index covers approximately 85% of the Indian equity universe.
MSCI Brazil Index (referred to as Brazil herein): Inception Date: January 01, 2001. The MSCI Brazil Index is designed to measure the performance of the large and mid-cap segments of the Brazilian market. The index covers about 85% of the Brazilian equity universe.
MSCI Saudi Arabia Index: The MSCI Saudi Arabia Index is designed to measure the performance of the large and mid-cap segments of the Saudi Arabia market. The index incorporates foreign ownership limit restrictions. With 37 constituents, the index covers approximately 85% of the free-float adjusted market capitalization in Saudi Arabia. The index was launched on October 3, 2014.
MSCI Turkey Index: The MSCI Turkey Index is designed to measure the performance of the large and mid-cap segments of the Turkish market. With 12 constituents, the index covers about 85% of the equity universe in Turkey. The index was launched on January 31, 1990.
MSCI Indonesia Index: The MSCI Indonesia Index is designed to measure the performance of the large and mid-cap segments of the Indonesian market. With 25 constituents, the index covers about 85% of the Indonesian equity universe. The index was launched on May 31, 1990.
MSCI Emerging Markets Information Technology Net Total Return USD Index: The MSCI Emerging Markets Information Technology Net Total Return USD Index is a free-float weighted equity index. The parent is the MSCI Emerging Markets Index.
MSCI EM Utilities Sector Index: The EM Utilities Sector Index is a free-float weighted equity index. It was developed with a base value of 100 as of December 31, 1998. The parent index is the MSCI Emerging Markets Index.
MSCI EM Industrials Index: The MSCI EM Industrials Index is a free-float weighted equity index. It was developed with a base value of 100 as of December 1, 1998. The parent index is the MSCI Emerging Markets Index.
MSCI EM Energy Sector Index: The MSCI EM Energy Sector Index is a free-float weighted equity index. It was developed with a base value of 100 as of December 31, 1998. The parent index is the MSCI Emerging Markets Index.
MSCI Emerging Markets Communication Services Net Total Return USD Index: The MSCI Emerging Markets Communication Services Net Total Return USD Index is a free-float weighted equity index. The parent index is the MSCI Emerging Markets Index. It is a GICS level 1 Index.
MSCI EM Materials Industry Group Index: The MSCI EM Materials Industry Group Index is a free-float weighted equity index with a base value of 100 as of December 31, 1998. The parent index is the MSCI Emerging Markets Index.
MSCI Emerging Markets Consumer Discretionary Net Total Return USD Index: The MSCI Emerging Markets Consumer Discretionary Net Total Return USD Index is a free-float weighted equity index. The parent index is the MSCI Emerging Markets Index.
MSCI EM Financials Index: The MSCI Emerging Markets Financials Index captures large and mid-cap representation across 24 EM countries. All securities in the index are classified in the financials sector as per the Global Industry Classification Standard (GICS).
MSCI EM Consumer Staples Index: The MSCI Emerging Markets Consumer Staples Index captures large and mid-cap representation across 24 emerging markets countries. All securities in the index are classified in the Consumer Staples sector as per the Global Industry Classification Standard (GICS).
MSCI EM Health Care index: The MSCI Emerging Markets Health Care Index is designed to capture the large and mid-cap segments across 24 EM countries around the world. All securities in the index are classified in the Health Care sector as per the Global Industry Classification Standard (GICS).
MSCI China Consumer Discretionary Index: The MSCI China Consumer Discretionary Index captures large and mid-cap representation across China H shares, B shares, Red chips, and P chips. Currently, the index also includes Large Cap A and Mis Cap A shares represented at 20% of their free float-adjusted market capitalization. All securities in the index are classified in the Consumer Discretionary sector as per the Global Industry Classification Standard (GICS).
Carefully consider the Fund's investment objectives, risk factors, charges, and expenses before investing. This and additional information can be found in the Fund's full and summary prospectus, which may be obtained by visiting www.kraneshares.eu. Read the prospectus carefully before investing.
The views and opinions expressed in this material are those of the authors Krane Funds Advisors. These opinions have been given in good faith but are subject to change without notice. It is the responsibility of the investor to evaluate the accuracy, completeness, and usefulness of any opinions, advice, services, or other information provided.
The ability of the KraneShares MSCI China A 50 Connect UCITS to achieve its investment objective is dependent on the continuous availability of A-Shares and the ability to obtain, if necessary, additional A-Shares quotas. If the Fund is unable to obtain sufficient exposure due to the limited availability of A-Shares quotas, the Fund could seek exposure to the component securities of the Underlying Index by investing in other types of securities. The Fund may invest in derivatives, which are often more volatile than other investments and may magnify the Fund's gains or losses.
R_EU_KS