

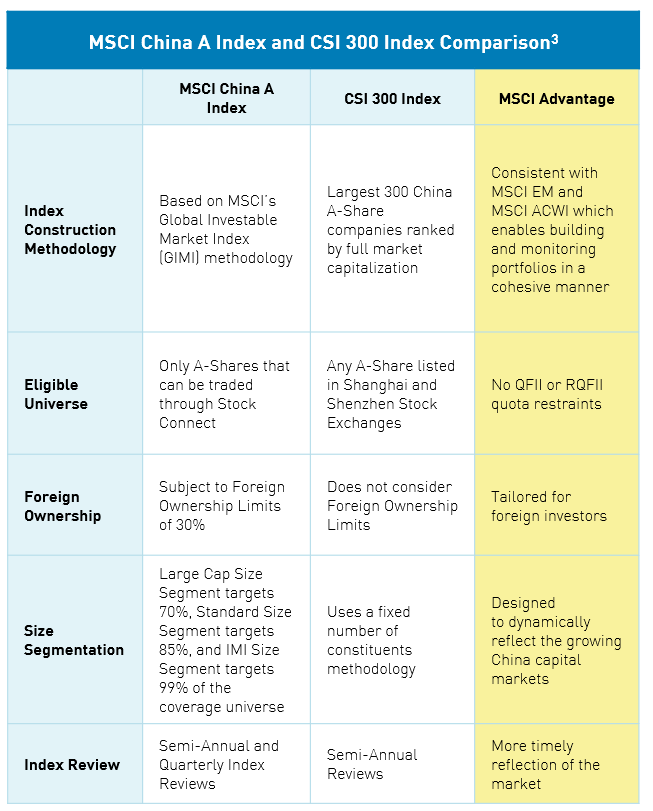
Tracking the MSCI Inclusion: the MSCI China A Index versus the CSI 300 Index

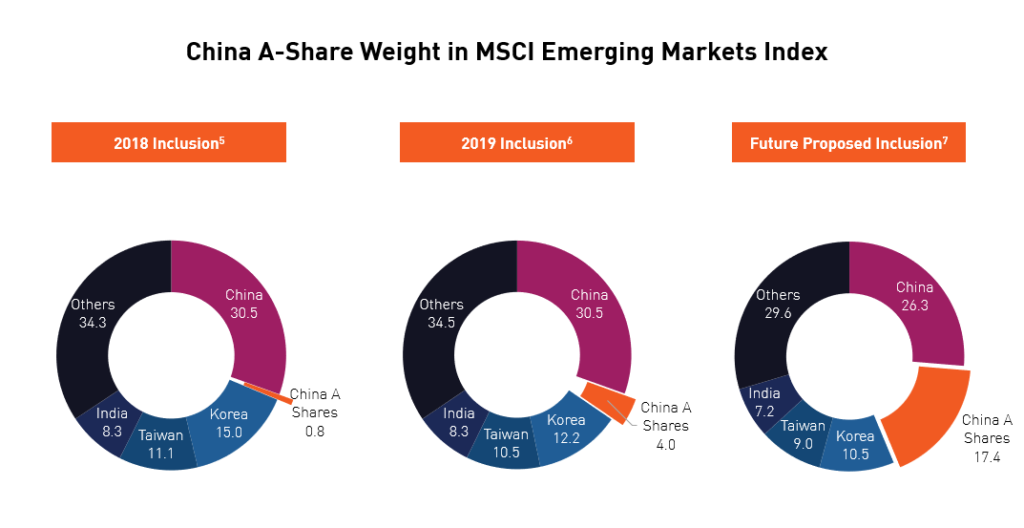
The proforma weighting of China A-shares within the MSCI Emerging Market Index was released Thursday 7 November ahead of the November 26th rebalance. After the rebalance, the inclusion factor of China A-Shares in MSCI's Emerging Market Indexes will reach 20%1.
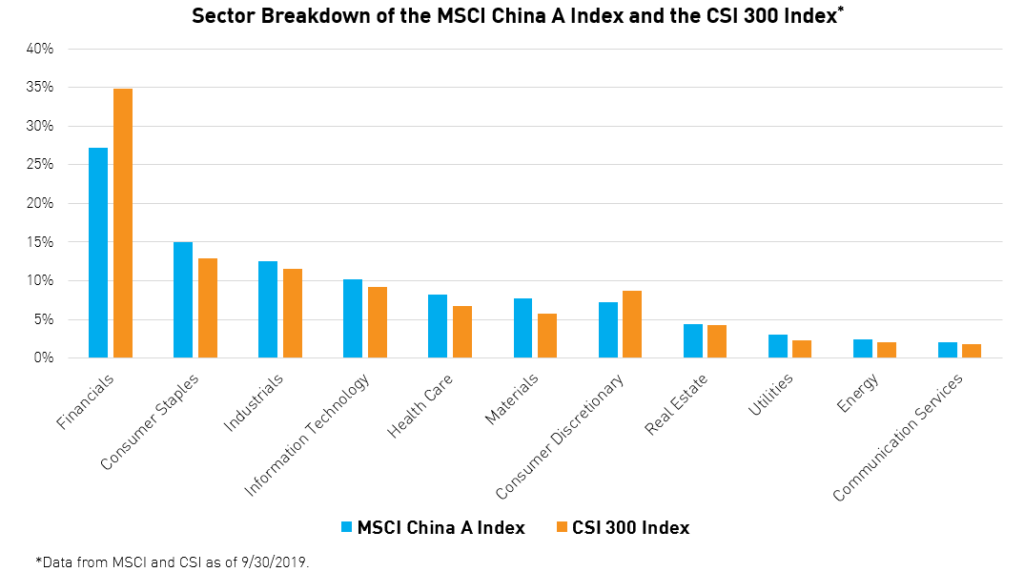
We believe that the MSCI China A Index has distinct advantages over other popular Mainland China benchmarks, in particular, the CSI 300 Index. The CSI 300 Index, originally built for domestic Chinese investors, consists of the 300 largest China A-Share stocks ranked by market capitalization. In comparison, the MSCI China A Index currently tracks 443 securities that meets MSCI's criteria for international investors2.
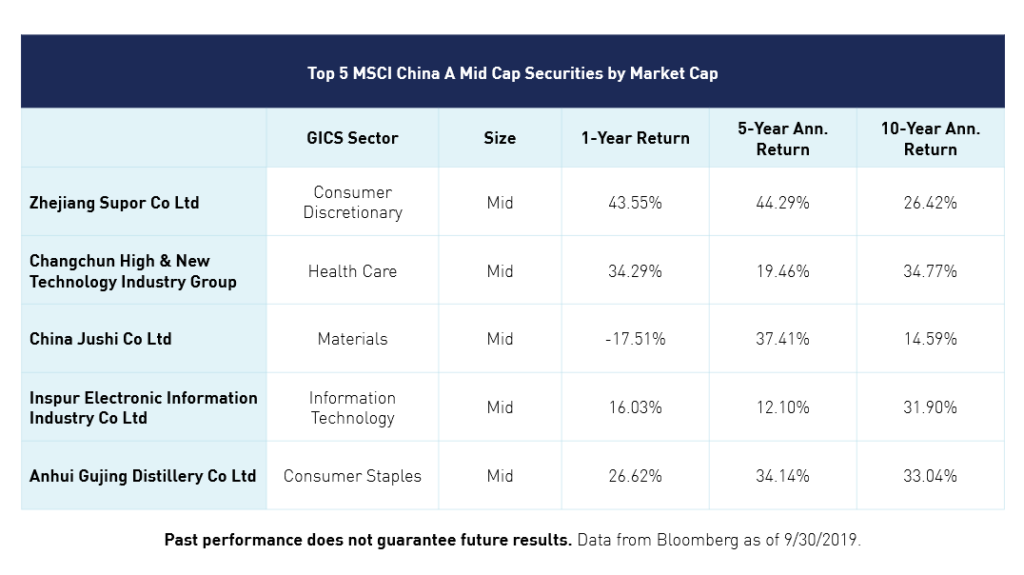
While the CSI 300 Index only includes Large Cap securities, the MSCI China A Index is more comprehensive. As of the November inclusion, 204 China A-shares will be added, 189 of which are Mid Caps1. The constituent count overlap of the Index with the CSI 300 Index is 53%3.
With $1.8 trillion tracking the MSCI EM Index alone4, the MSCI inclusion could trigger significant institutional flows from both passive and active managers into the A-Share securities in the MSCI China A Index.
The MSCI China A Index Advantage
With a decreased weight in financials and increased weight in growth sectors such as information technology and healthcare, we believe the MSCI China A Index is a more holistic representation of the mainland China market than the CSI 300 Index.
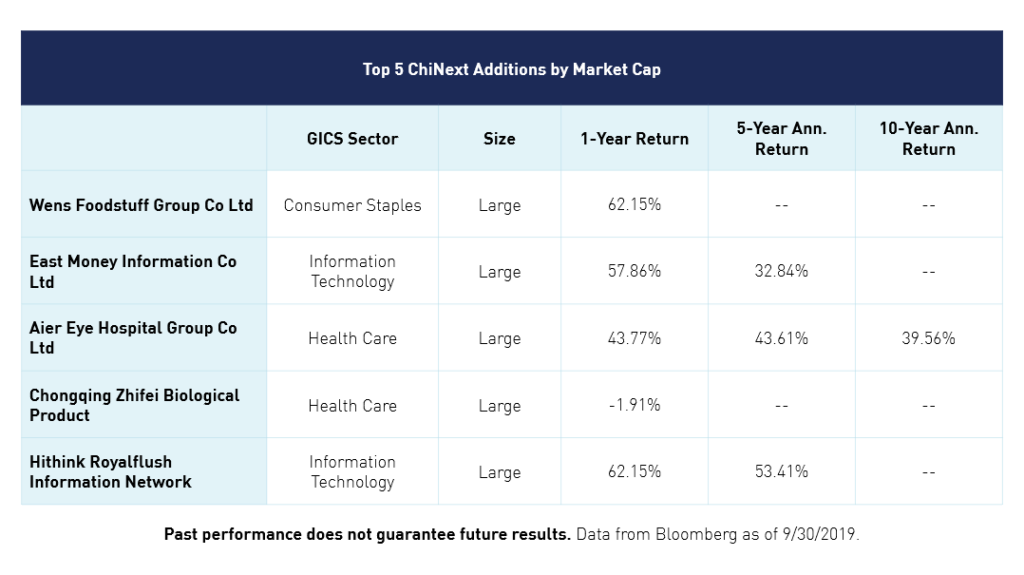
Additionally, the November inclusion of Mid caps and more ChiNext8 securities further diversifies the constituent makeup of the MSCI China A Index and distinguishes it from the CSI 300 Index.
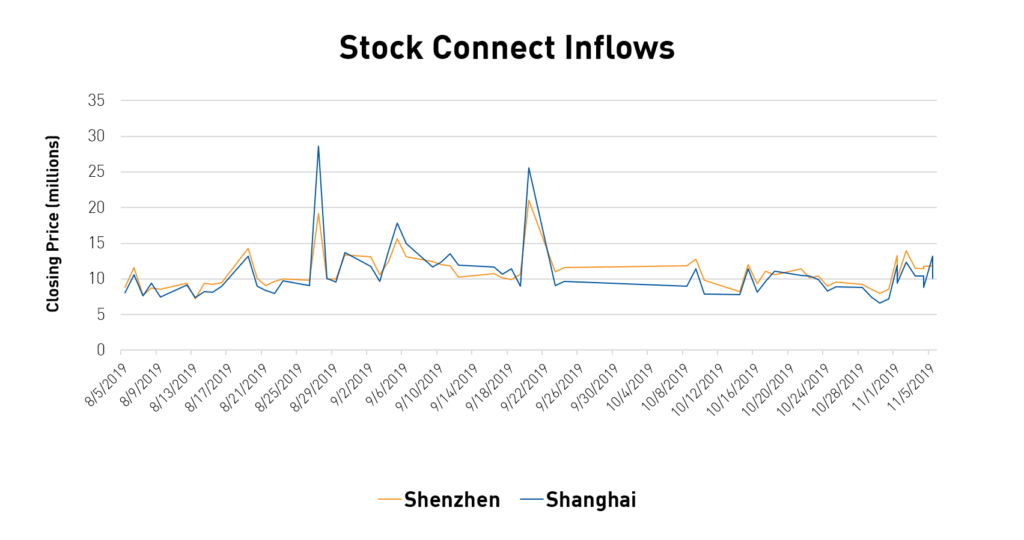
In anticipation of additional MSCI Mid Cap inclusions later this month, inflows into Shenzhen Connect have already noticeably increased, exceeding that of Shanghai Connect over the past 3 months. This is significant because Shenzhen's exchange is much smaller than the Shanghai exchange (75% smaller by market cap), and primarily consists of emerging, growth sector companies. Since August, investors have poured $92.4 billion into Shenzhen listed stocks versus $89.7 billion into Shanghai9. The heavier purchasing of relatively smaller market cap Shenzhen names implies that investors are buying inclusion stocks ahead of the November rebalance.
Indexes that do not hold Mid Caps, like the CSI 300 Index, may not be optimized to benefit from the influx of foreign investments into this specific subset of China A-shares. However, we believe the MSCI China A Index, which is becoming more diverse through the incremental inclusion process, is in a better position to evolve and grow alongside China's economy.
When it comes to investing in ETFs, bigger is not necessarily better. Rather than focus on an ETF’s AUM size, proper due diligence includes thoroughly understanding your exposure from both a sector and exchange perspective. To best capture China's expanding capital markets, an ETF benchmarked to the MSCI China A Index is preferable for its dynamic constituent makeup which better harnesses the investment opportunity in China.
- MSCI, “MSCI Will Increase the Weight of China A Shares in MSCI Indexes”, 2/28/2019.
- Data from MSCI as of 9/30/2019.
- Data from Bloomberg as of 9/30/2019, calculated by KraneShares.
- As of 6/30/2018, as reported on 9/30/2018 by eVestment, Morningstar and Bloomberg, retrieved 9/30/2019.
- MSCI.com/China retrieved 9/30/2019
- “MSCI Will Increase The Weight Of China A Shares In MSCI Indexes” MSCI, 9/30/2019
- MSCI, “China and the future of equity allocations”, June 2019.
- ChiNext Market is a board of the Shenzhen Stock Exchange that was created to help encourage entrepreneurship, inspire creativity, and popularize innovative business models in China.
- Data from HKEx as of 11/01/2019
Index Definitions
The MSCI China A Index: captures large and mid-cap representation across China securities listed on the Shanghai and Shenzhen exchanges. The index covers only those securities that are accessible through "Stock Connect". The index is designed for international investors and is calculated using China A Stock Connect listings based on the offshore RMB exchange rate (CNH). The inception date of the Index was 3/01/2018.
CSI 300 Index: consists of the 300 largest and most liquid A-share stocks. The Index aims to reflect the overall performance of China A-share market. The inception date of the Index was 4/08/2005.
This information is being communicated by KraneShares, which is an appointed representative of DMS Capital Solutions UK Limited, which is authorised and regulated by the Financial Conduct Authority in the United Kingdom under the reference number 503325. R_KS_DMS.