


The Art of Investing In China: January 2020 Review

By Dr. Xiaolin Chen
Happy Lunar New Year!
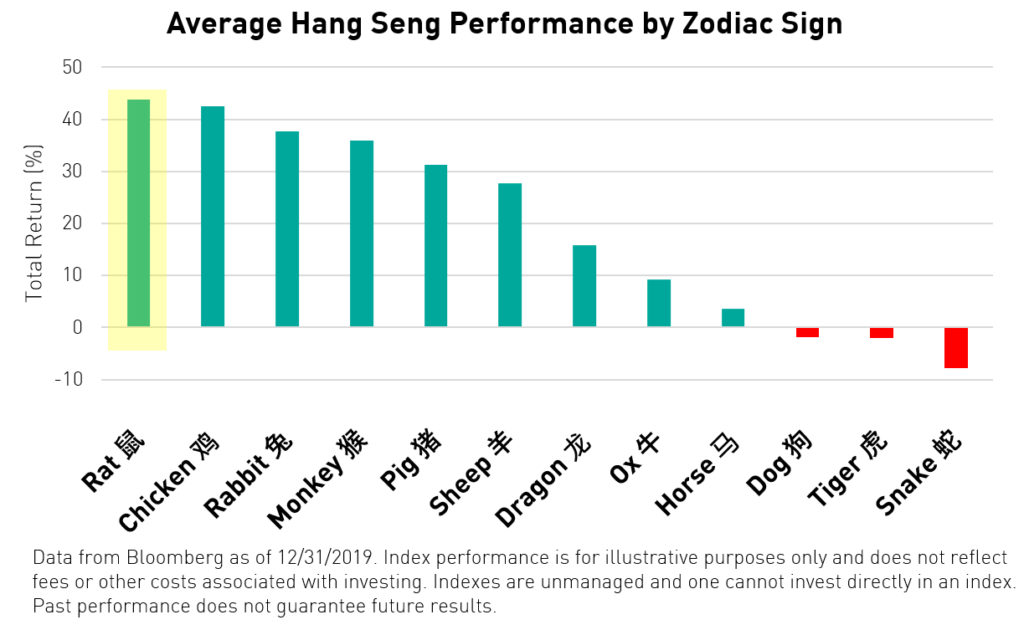
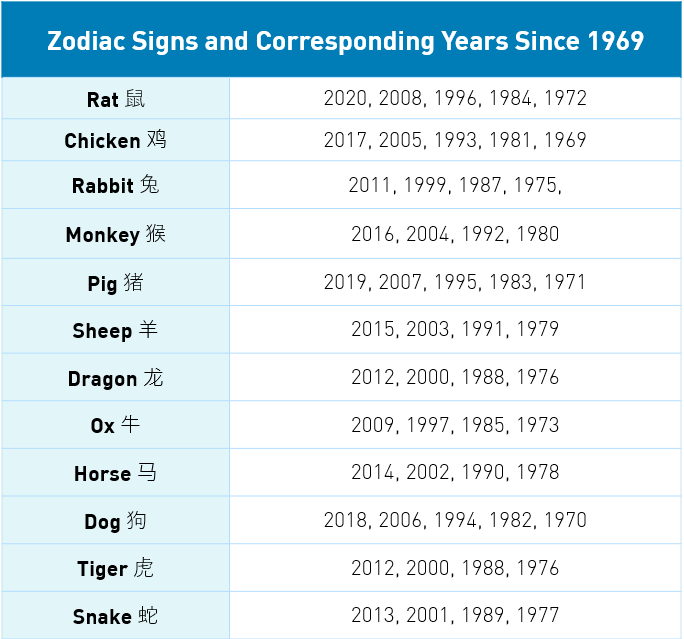
2020 is the year of the rat. The Chinese lunar calendar is based on a twelve-year cycle and every year is named after one of 12 animals. Among Asian cultures, people often predict their fortune based on the symbolism of the traditional zodiac signs in a certain year. Although it may seem like pure superstition to link stock market performance with the Chinese zodiac, we ran an analysis of historic stock market performance by zodiac year, just for fun.
The Hang Seng Index has the longest track record available to reflect the performance of major Chinese stocks. The index’s trading history goes back to 1969, completing four full cycles of Chinese zodiacs.
Had we run this analysis earlier we may have predicted that 2018, a year of the dog, would have been a tough year for the market. Analysis of the historical performance of the Hang Seng Index shows that years of the dog have the third-worst performance, on average, among all zodiac signs. The dog did indeed bite, multiple times. The year of the pig (2019) has been the fifth-best year for the index with an average return of 31.3%, behind the year of the monkey (35.9%), the year of the rabbit (37.8%), the year of the rooster (42.5%). This year, a year of the rat, is in the zodiac category that, historically, has demonstrated the highest average performance of all the zodiacs with an average return of 43.9%. We certainly hope the trend continues this year.
January Review
Three key events occurred in China’s capital markets in January. These were, in chronological order: (1) another Reserve Requirement Ratio (RRR) cut, (2) the signing of a phase-one US-China trade agreement, and (3) the coronavirus outbreak
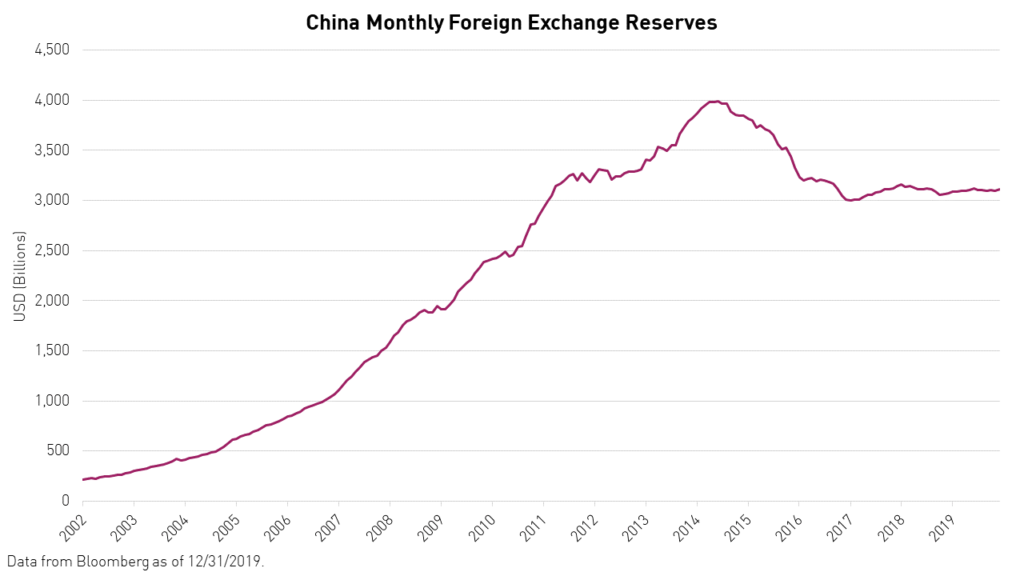
Monetary policy in 2019 largely disappointed investors who were hoping that China's central bank would deliver a more powerful boost to growth. Growth in property investment and credit* were both largely flat for the year, which is reflective of slowing growth in the economy.1 Policymaking in 2019 was characterized by maintaining a delicate balance between supporting growth and financial deleveraging. These conflicting policy goals permitted only limited measures of selective easing. However, the easing of both monetary and fiscal policy is likely to continue in 2020 to help lower corporations’ borrowing and funding costs and allow banks to support the economy at a fundamental level. Given China’s sizable fiscal reserves, current account surplus, and drive to catch up with global central banks’ aggressive easing stance, the PBoC should have plenty of space to implement more targeted policy. And, indeed, China’s central bank kicked off 2020 by announcing a broad-based RRR cut of 50bps on New Year’s Day.
The US-China trade deal would require quite a lengthy paragraph if we were to tell the entire story. The shortened version is that market sentiment has greatly improved since the phase-one trade deal was signed on January the 15th. The terms of the agreement are largely to be expected. China agreed to purchase $200bn of additional US goods over two years and enhanced protections for US intellectual property. In return, the US agreed to lower the tariff rate on $100bn of Chinese goods from 15% to 7.5% on 14th February.2
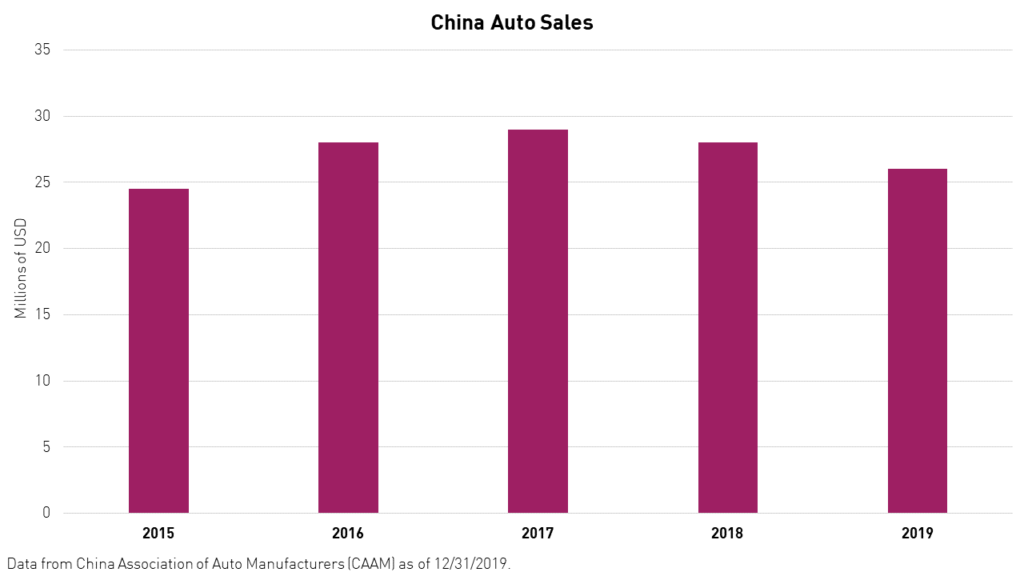
Although the remainder of the trade deal has yet to be negotiated, it appears that both the US and China are now eager to cooperate with one another. A full resolution would greatly reduce the uncertainty that has weighed on manufacturers worldwide. The easing of trade tensions provides a very clear signal to global investors that tariffs will fall from here onwards. Domestically, the two-year decline in auto sales seems to be over and the wage growth depression due to manufacturing layoffs also appears to have peaked. This should lead to a pickup in consumer spending in 2020.
The coronavirus outbreak, which began on January 23rd in Wuhan, China, continues to draw headlines and move markets. Subsequently, domestic and international travel restrictions were announced to contain the spread of the virus. Near term, the coronavirus outbreak will remain a challenge. However, compared to their response to the SARS outbreak in 2003, government officials in China are taking more effective measures to contain the spread of the virus and are offering far more transparency.
Although it is too early to quantify the economic impact of the virus, some sectors, such as travel, may face downward pressure in the short-term, while others, such as E-Commerce and online education, may benefit.
The travel industry overall is likely to see a near term correction due to the outbreak and ensuing policy measures meant to stem its outbreak. Approximately 70% of Trip.com’s hotel and air revenues come from leisure-related bookings, which could be severely eroded by government-mandated free flight cancellations and increases in its customer service workload.3 The stock has fallen more than 10% since the initial lockdown announcement.4
Most cities in China have postponed the reopening of schools and suspended after-school tutoring activities following the Chinese New Year holiday in order to control the spread of the virus. However, TAL Education, which offers after-school tutoring programs for both primary and secondary school students in China, can still deliver quality educational content to its customers. Now a pioneer in online education, TAL Education has developed strong capabilities in almost every city in China to move students from offline to online. Therefore, TAL Education may be only minimally affected. Nonetheless, for other offline players in the education space, the negative impact on their cash flows will be material and challenge their survival. However, the closures also present an opportunity for industry leaders such as TAL Education to gain market share.
Due to greater demand and stricter screening policies following the holidays, logistics companies are currently under strain, which could impact both the cost and timeliness of deliveries. Nonetheless, the coronavirus-fueled selloff in the sector only makes E-Commerce companies such as Alibaba all the more attractive. Alibaba boasts a more comprehensive logistics and payment infrastructure and a more resilient source of profitability than brick and mortar retail. Despite variable sentiment stemming from the outbreak and unfavorable seasonality, E-Commerce companies such as Alibaba may gain market share from offline retailers and continue to penetrate lower-tier cities in China as the preferred channel for supporting the daily lifestyle of individuals with rising incomes.
As a result of the SARS outbreak in 2003, global GDP declined for a short period but was followed by a quick recovery in 2003.5 Using SARS as a point of reference, we believe this period is transitory and do not recommend asset allocation changes based solely on coronavirus-related corrections. These corrections only make China fundamentally attractive as an asset class due to its relative valuation. Therefore, the outbreak presents a decent entry opportunity even in the event of further short-term corrections.
I invite you to read our article Coronavirus In Context, which examines the economic impact of SARS and what it might tell us about the coronavirus outbreak.
Did you know?
The most important trend in China’s capital markets in 2019 is certainly the country’s efforts to connect with the rest of the world.
1. The Shanghai Stock Exchange is connecting with the outside world
On 22nd April 2019, Shanghai Stock Exchange (SSE) and Japan Exchange Group (JPX) agreed to establish China-Japan ETF Connectivity. The connect program will create opportunities for cross-border securities investment and enable the listing of feeder ETFs of ETFs investing in Chinese or Japanese assets.6
On 17th June 2019, the China Securities Regulatory Commission (CSRC) and the Financial Conduct Authority of the United Kingdom (FCA) released a joint announcement of their approval in principle of the establishment of the Shanghai-London Stock Connect. On the same day, the London Stock Exchange (LSE) held the launch ceremony for the westbound business of Shanghai-London Stock Connect and the listing of global depositary receipts (GDRs) issued by Huatai Securities Co., Ltd. (“Huatai”), a company listed on both Shanghai Stock Exchange (SSE) and Hong Kong Stock Exchange (SEHK). The scheme provides access for both primary market and secondary market activities.7
2. MSCI continues to include China’s onshore equities in its broad indexes
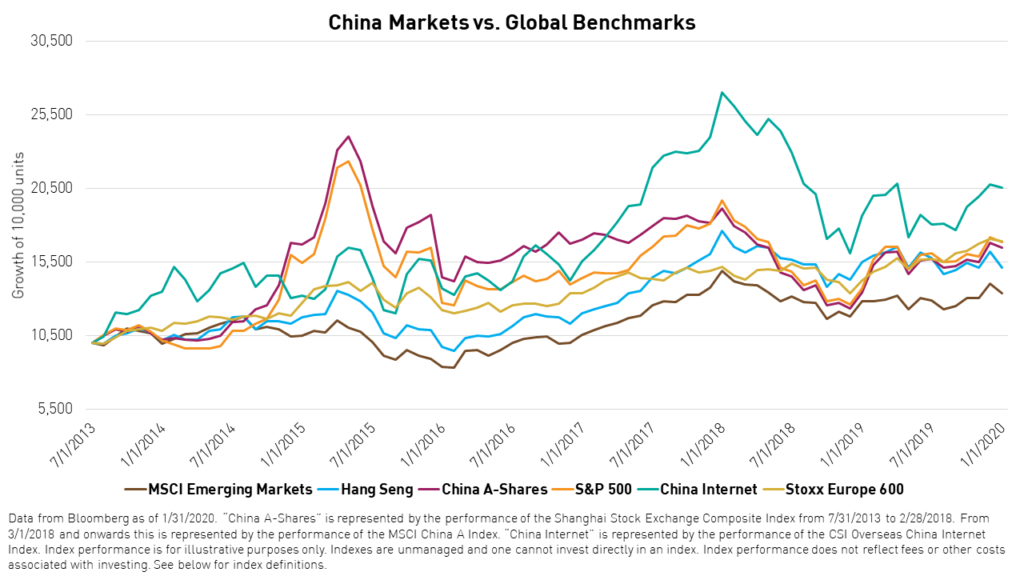
MSCI started to partially include China A-shares in the MSCI Emerging Markets Index on 31st May 2018. The inclusion factor increased from 5% in 2018 to 20% in 2019 and the resulting A-shares weight increased from 78bps to 410bps in the MSCI Emerging Markets Index. In the event of full inclusion, China A-share equities of varying market capitalizations would exceed 1700bps of the MSCI Emerging Markets Index. According to MSCI, there are approximately $1.5tn tracking the MSCI EM Index, and a full inclusion would trigger an inflow of $255bn into the A-share market, not even counting the flows resulting from other index providers’ inclusion announcements.8
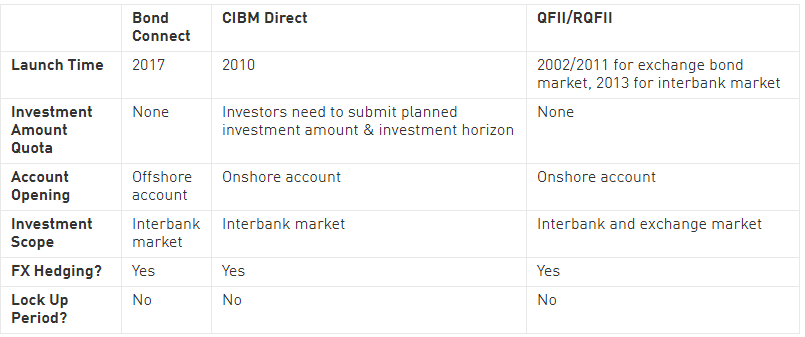
3. The second-largest Fixed Income market in the world is opening up to global investors
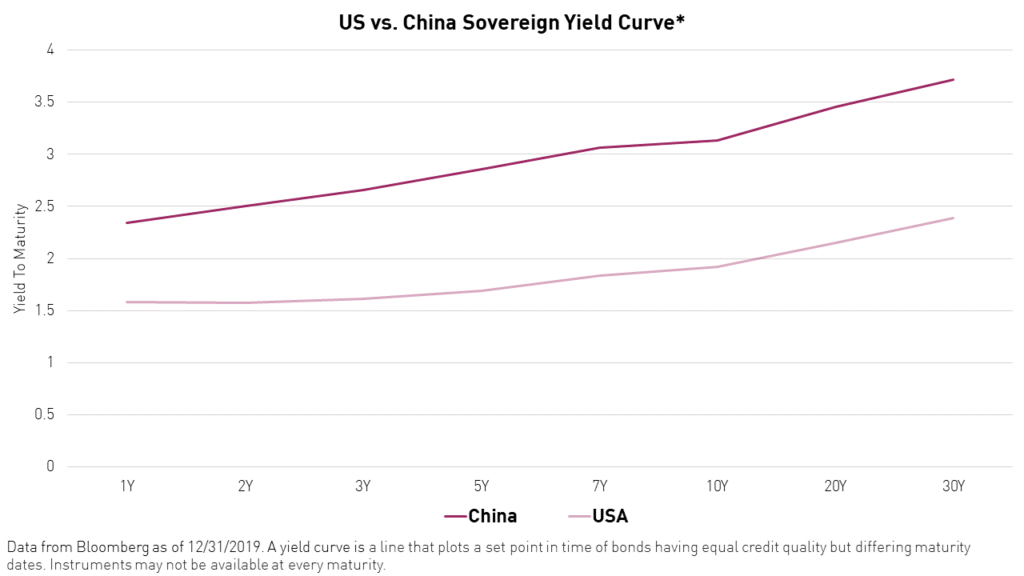
China’s onshore bond market is the second-largest in the world at $13.8tn9 and offers international investors tax-free opportunities for enhanced returns and diversification. It is too big to ignore both in terms of investment opportunity as well as the insight it provides into China’s economy and financial system.
In April 2019, onshore bonds were included in the Bloomberg-Barclays Global Aggregate Index. And, in February 2020, JPMorgan will include them in its emerging market index GBI-EM. China currently offers relatively higher yields than developed countries in government bonds as a result of its monetary policy stance. The 10-year onshore RMB CGBs offer around 140bp yield over US Treasuries, which indicates a yield pick-up even after considering hedging costs. Moreover, the asset class also demonstrates a low correlation with global asset prices. For example, CGBs have a 29% correlation rate with US Treasuries, which is much lower than Germany and Japan at around 60%.10
The year of the rat is considered a year of new beginnings and is known to bring prosperity. Will it bring prosperity for capital markets? We will find out in 11 months' time...
*Credit defined as Total Social Financing (TSF)
Citations:
- Liang, Hong. "Macroeconomics," CICC Research. December 2019.
- Brown, Chad P. “US-China Trade War Tariffs: An Up-to-Date Chart,” Peterson Institute For International Economics (PIIE). December 13, 2019.
- Wong, Binnie. "China Internet: thriver or survivor through coronavirus," HSBC Global Research. January 31, 2020.
- Data from Bloomberg as of 10 February, 2020.
- Liu, Liu. “China Macro Brief: Review of Economic Impact of SARS in 2003,” CICC Research. January 21, 2020.
- Shanghai Stock Exchange. "China-Japan ETF Connectivity," 2019.
- London Stock Exchange. "Market Notice: Shanghai-London Stock Connect," 12 June 2019.
- MSCI, “China and the future of equity allocations”, June 2019. Retrieved 12/31/2019.
- Data from Bank of International Settlements as of 6/30/2019
- Data from Bloomberg as of 2/13/2020. Weekly correlation from 12/31/2016 to 2/13/2019. Japan = 20-year government bond. Germany = 10-year government bond average auction yield. China = 10-year government bond.
Index Definitions:
Hang Seng Index: The Hang Seng Index ("HSI"), the most widely quoted gauge of the Hong Kong stock market, includes the largest and most liquid stocks listed on the Main Board of the Stock Exchange of Hong Kong. The index was launched on November 24, 1969.
MSCI Emerging Markets Index: The MSCI Emerging Markets Index is a free-float weighted equity index that captures large and mid cap representation across Emerging Market (EM) countries. The index covers approximately 85% of the free-float adjusted market capitalization in each country. The index was launched on January 1, 2001.
Shanghai Stock Exchange Composite Index: The Shanghai Stock Exchange Composite Index is a capitalization-weighted index. The index tracks the performance of all A-shares and B-shares listed on the Shanghai Stock Exchange. The index was launched on July 15, 1991.
MSCI China A Index: The MSCI China A Index captures large and mid-cap representation across China securities listed on the Shanghai and Shenzhen exchanges. The index covers only those securities that are accessible through "Stock Connect". The index is designed for international investors and is calculated using China A Stock Connect listings based on the offshore RMB exchange rate (CNH). The index was launched on March 1, 2018.
CSI Overseas China Internet Index: The CSI Overseas China Internet Index selects overseas-listed Chinese Internet companies as the index constituents; the index is weighted by free-float market cap. The index can measure the overall performance of overseas-listed Chinese Internet companies. The Index is within the scope of the IOSCO Assurance Report as of 30 September 2018. The index was launched on September 20, 2011.
S&P 500 Index: The S&P 500 Index is widely regarded as the best single gauge of large-cap U.S. equities. There is over USD 9.9 trillion indexed or benchmarked to the index, with indexed assets comprising approximately USD 3.4 trillion of this total. The index includes 500 leading companies and covers approximately 80% of available market capitalization. The index was launched on March 4, 1957.
Stoxx Europe 600 Index: The STOXX Global 1800 derived benchmark indices are designed to provide a broad yet investable representation of the world's developed markets of Europe, North America and Asia/Pacific, represented by the STOXX Europe 600, the STOXX North America 600 and the STOXX Asia/Pacific 600 indices.The STOXX Global 1800 Index is a combination of all three indices. The EURO STOXX Index, a Eurozone subset, is derived from the STOXX Europe 600, as is the STOXX Nordic, a subset covering the Nordic region (Denmark, Finland, Iceland, Norway and Sweden). The index was intrtoduced in 1998.