


Electric Vehicles: A Solution For Slowing Growth?
By Anthony Sassine, CFA
Executive Summary
- Demand for electric vehicles (EVs) is projected to continue to grow - despite slowing growth and rising rates - driven by government policies, innovation, a low base effect compared to internal combustion engine (ICE) vehicles, and strong momentum in consumer adoption.
- Higher oil prices are driving electric vehicles closer to cost parity with ICE vehicles, accelerating adoption globally. Although metals prices have risen too, we believe that new supply coming to market will return battery prices to their previous downward trend.
- The recent passage of the Inflation Reduction Act (IRA) in the United States, which includes $369 billion in renewable energy investment and tax credits for EVs, reinforces our belief that countries will have to do more to meet their climate goals.
- The KraneShares Electric Vehicles & Future Mobility ESG Screened UCITS ETF (Ticker: KARS) offers exposure to the electric vehicle ecosystem that is varied in terms of country and industry exposures and exhibits a low correlation to major equity indexes.
Introduction
On Tesla’s most recent earnings call, Elon Musk stated: “we do not have a demand problem but a production problem.” Most electric vehicle (EV) manufacturers are currently focused on scaling operations and improving their management of supply chains to meet demand. According to Elon, last year’s chip shortage provided Tesla with an advantage: learning how to build cars with significantly fewer chips by eliminating ancillary chip uses and leveraging chips for multiple uses. Next on Tesla’s radar is trying to derive multiple uses from battery cells, including for energy storage to improve range.
We believe the EV ecosystem continues to be one of the most promising long-term investment themes globally. With fears of slowing growth and potential recessions in Europe and the US, investors are looking for opportunities to diversify*. We believe the KraneShares Electric Vehicles & Future Mobility ESG Screened UCITS ETF (Ticker: KARS), which invests in the EV ecosystem, is a potential solution.
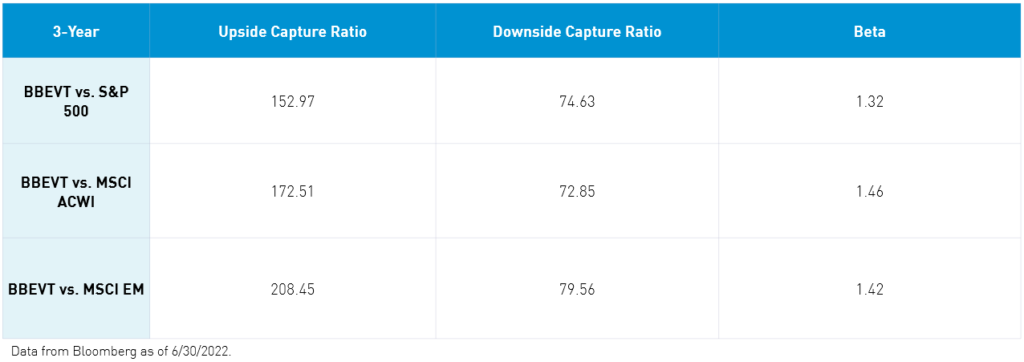
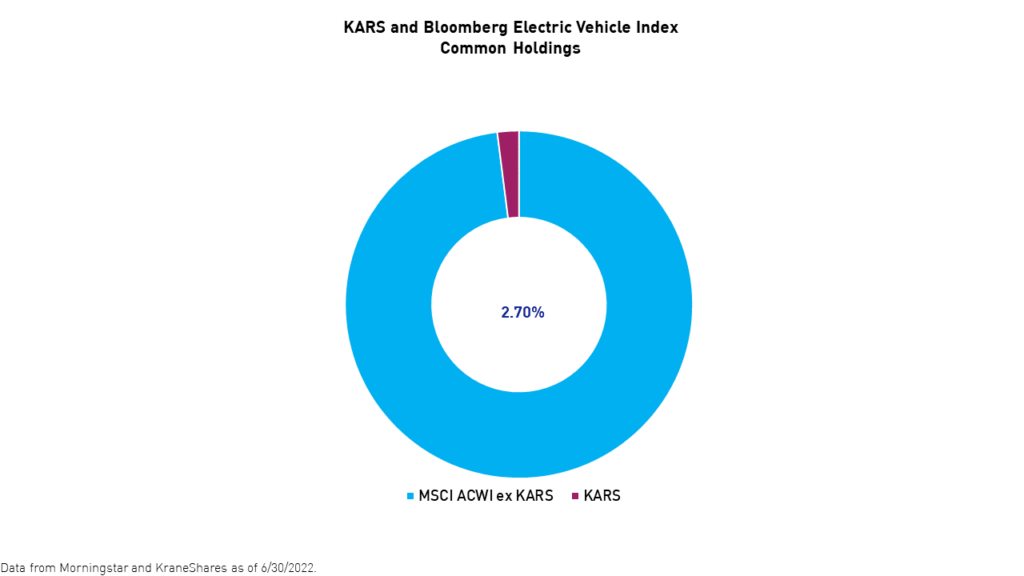
EV demand is projected to continue to grow - despite slowing growth and rising rates - driven by government policies, innovation, a low base effect compared to internal combustion engine (ICE) vehicles, and strong momentum in consumer adoption. The Bloomberg Electric Vehicles Index has exhibited a lower correlation to major global indexes compared to other Electric Vehicles indexes over the past three years, in addition to attractive upside and downside capture ratios. The index’s low overlap with the S&P 500 and MSCI ACWI makes the electric vehicle investment opportunity, in our opinion, an adequate thematic exposure with the potential to shield portfolios during systematic downturns.
*Diversification does not ensure a profit or guarantee against a loss.
Differentiated Potential Source of Alpha
The Bloomberg EV Index has a relatively low 3-year correlation with global indexes.
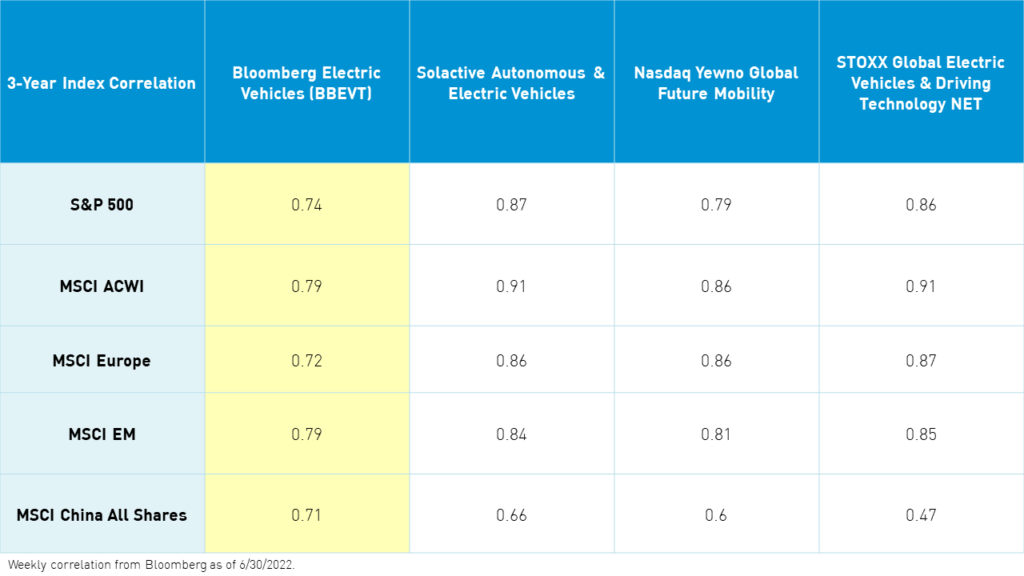
We believe the EV investment opportunity could provide a differentiated source of alpha given its unique growth drivers.
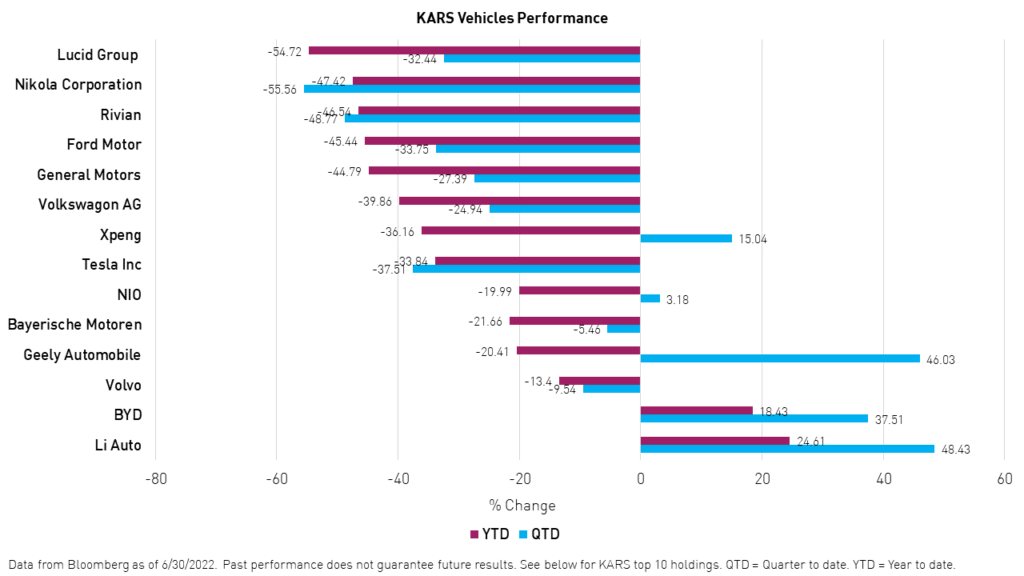
Year-to-Date Performance Review
While sales of internal combustion engine (ICE) vehicles declined by 8.5% year-over-year during the first half of 2022, sales of EVs managed to grow by 60% plus. EV makers, led by BYD and Tesla, have sold 660,00 vehicles this year as of the end of June.1
Despite the excitement, EV stocks struggled in 2022 after a strong two years. The market was pessimistic about electric vehicle makers’ ability to deal with supply-side disruptions spurred by the war in Ukraine and lockdowns in China. Then, a rotation from growth to value contributed further to the decline in the share prices of EV makers. We believe that, due to the recent decline, now represents an attractive entry point as the long-term growth story of EVs remains intact.
KARS declined -11.07% during the second quarter and has lost -19.45% year-to-date as of August 3, 2022.
For KARS current standard performance, please click here.
The performance data quoted represents past performance. Past performance does not guarantee future results. The investment return and principal value of an investment will fluctuate such that an investor’s shares, when sold or redeemed, may be worth more or less than their original cost, and current performance may be lower or higher than the performance quoted. For performance data current to the last month-end, please visit our website at www.kraneshares.eu or call +1 (855) 8KRANE8.
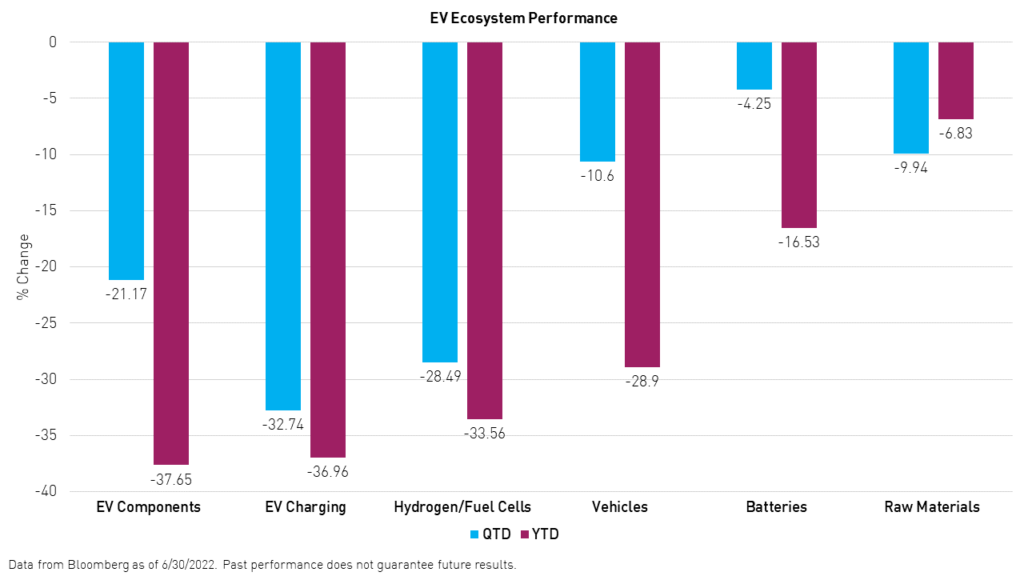
The recent passage of the Inflation Reduction Act (IRA) in the United States propelled EV infrastructure and hydrogen stocks after a tough two years. We believe the passage of the bill, which includes tax credits for fuel cell vehicles and EV infrastructure, will put these companies on a secular growth path for the next decade or so. Electric vehicle components manufacturers struggled as well, mainly due to lockdowns in Shanghai in April and May. Tesla’s and NIO’s suppliers are heavily concentrated in affected areas. The battery makers fared best during the quarter as they recovered significantly in June, following the declines in metals prices. Contemporary Amperex Technology Limited (CATL), China’s and the globe’s largest battery supplier, missed its gross margin by 10% during its most recent earnings report in May due to high input prices, but it rallied 30% in June. Raw materials companies were leading in terms of performance up until May. The sector lost 14% in June alone as commodity prices retreated.
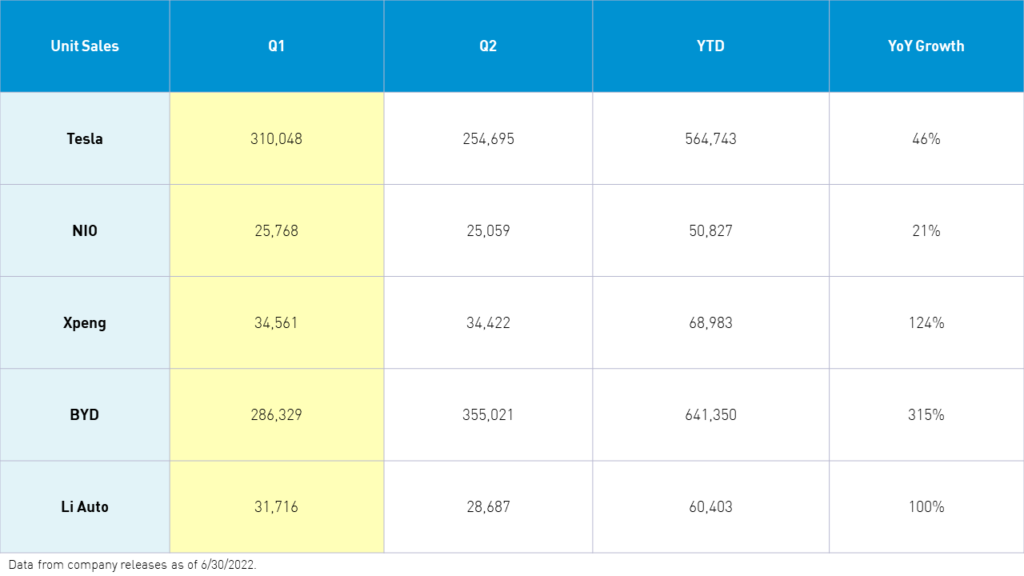
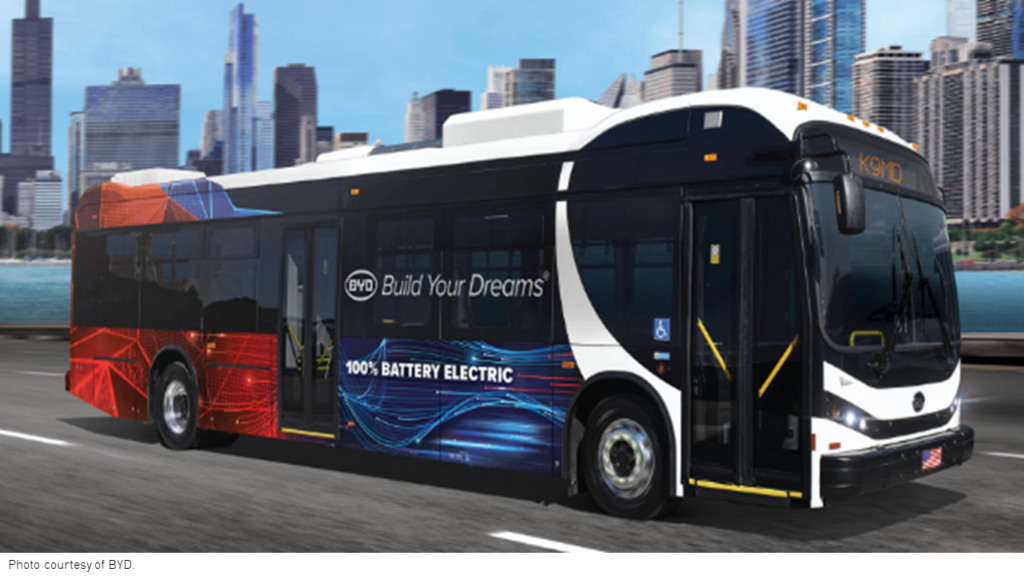
EV manufacturers saw record sales in Q1 and in June. Despite the lockdowns in April and May, electric vehicle sales grew +80% year-over-year during the first half of the year, led by BYD and Tesla. In May, BYD, which stands for "Build Your Dreams", became the top EV seller globally, dethroning Tesla. Xpeng and Li Auto EV sales grew 124% and 100% during the year’s first half. NIO’s growth was lower, registering 21% as customers seem to be awaiting the new EV launches (ET7, ES7, ET5), which are expected to kick off this summer fully. In March of 2022, NIO started delivering its awaited ET7. In August, NIO is expected to start the delivery of the newly announced ES7 SUV. NIO will also start delivering its ET5 car, which is supposed to be cheaper and a direct competitor to Tesla’s model Y. NIO reported a record non-refundable backlog in May. Investors may finally be rewarded for sticking with NIO through a turbulent year as it catches up with its peers in the year's second half.
LI auto, along with the other China-based EV manufacturers XPeng and NIO, performed well during the second quarter following the March lows as delisting and regulatory concerns in China eased. BYD continues to execute admirably. The vertically integrated automaker continues to be one of our and Warren Buffet's favorite EV makers. In addition to its leading electric vehicle business, BYD has a lucrative battery business (now available to other automakers), an electric bus and train business, and an electronic appliance business. Next time you are in London, San Francisco, or any major city, look for the BYD electric busses roaming the city streets.
On the other hand, Tesla suffered this quarter due to company-specific events, including its exclusion from the S&P 500 ESG index and the Twitter saga that continues to unfold. Tesla’s recent earnings report refocused the conversation on fundamentals, and the stock was up close to +10% the next day.
However, lockdowns in Shanghai brought sales in the area to an almost complete halt in April. The lockdowns impacted many EVs, especially Tesla and NIO, whose factories and most of their supply chains are in the Shanghai area.
Outlook
Bloomberg New Energy Finance (BNEF), in its most recent Electric Vehicles Outlook 2022 report, projected EV sales to hit 10.7 million in 2022 and 20.6 million by 2025. For the long term, the goal is to replace 1.3 billion ICE cars with EVs, which currently account for a mere 21 million cars on the road. China and Europe will account for nearly 80% of EV sales by 2025.1 The US is projected to represent 15%, but that depends on the path of US policy. The US’s future EV adoption seems to be totally in the hands of early adopters and innovators. To spur adoption, EVs must become cheaper and more appealing than traditional gas-powered vehicles. According to BNEF, many major emerging markets are also lagging in the ability or willingness to offer policy support. More help is needed, especially in populous countries such as India, Indonesia, and others, for adoption to accelerate further.
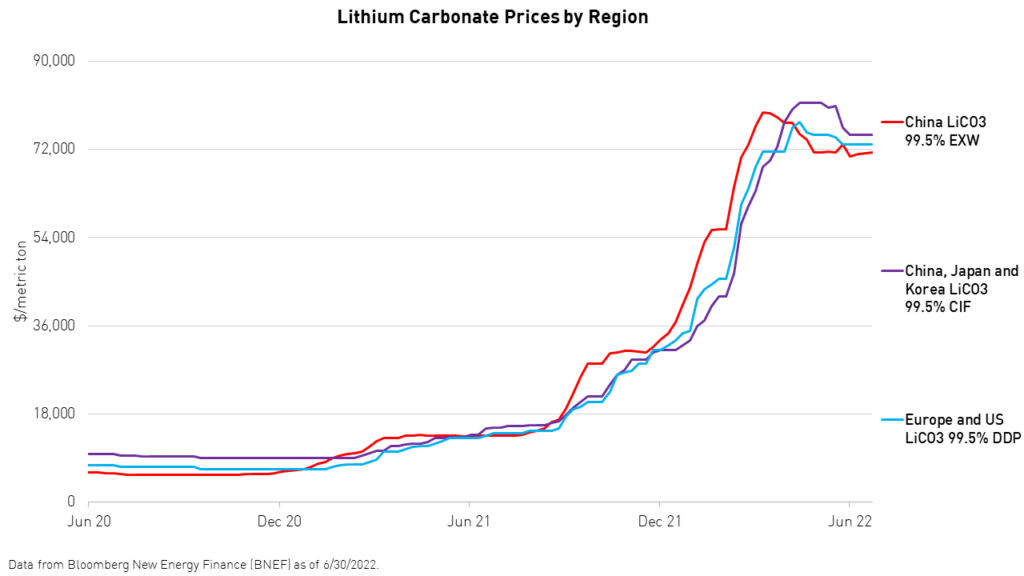
Supply-side disruptions may complicate production in the near term. The ICE parity dream, in which EV price would be like ICE pricing, seems to be further deferred due to the sharp rise in metal prices in 2022. Battery prices are expected to increase for the first time in many years, but resume downward trajectories in 2023, as more supply comes on board and innovators attempt to find solutions. Creating new battery chemistries (like sodium-ion-based batteries), optimizing existing chemistries, or as in Tesla’s case, finding a way to use battery cells for energy storage, can all help make EVs more affordable and trigger mass adoption on a large scale. BNEF projects that some models in some countries could hit price parity starting in 2024. By 2027-2028, most EV models in most countries will be cheaper than their ICE counterparts. In short, supply-side disruptions should be manageable as EV companies have been preparing for shortages, and record capacity will be coming online starting in 2023.
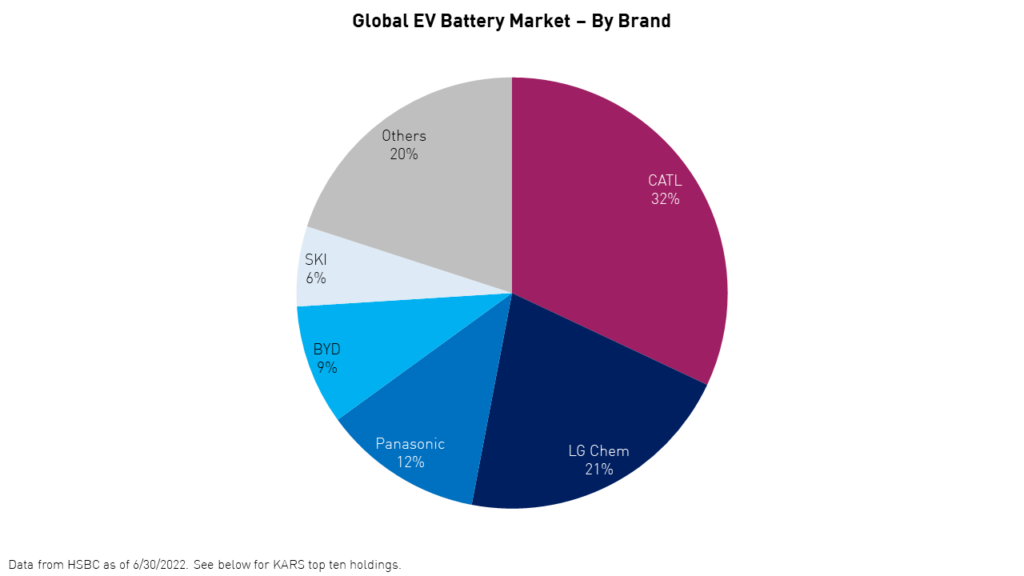
Company Highlight: Contemporary Amperex Technology Limited (CATL)

Finally, we would like to highlight one of the world's leading battery companies, CATL. As our Chief Investment Officer (CIO) Brendan Ahern puts it, CATLS is to electric vehicles what Alibaba is to E-Commerce. The Mainland China-listed company has fought giants in the industry such as Tesla, LG, Panasonic, and others to become the top battery company in the world. CATL ascended to this position through innovation in research and development and manufacturing. CATL now supplies more than 30% of the global market for batteries and more than 50% of the market in Greater China.2 The company recorded revenue of RMB 131 billion in 2021, representing nearly +160% growth year-over-year. CATL's revenue growth is expected to be 108% in 2022 and 45% in 2023. Tesla was CATL's largest customer in 2022, accounting for 19% of its total installations, followed by another Shanghai-based automaker SAIC, which accounted for 8% of its total installations. CATL just inked a deal with Ford to supply them with batteries starting in 2023.2
Investing In The Electric Vehicle Ecosystem
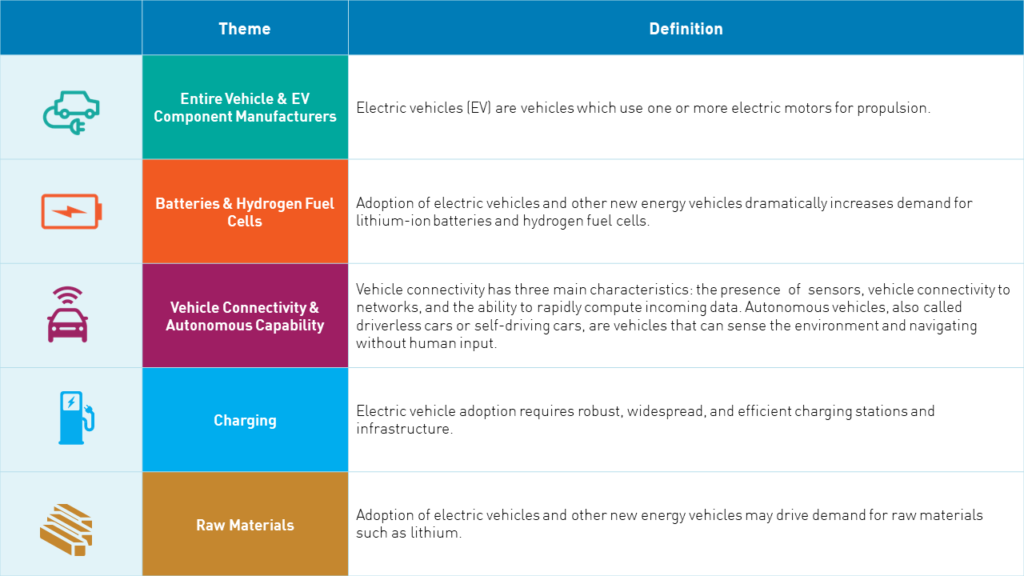
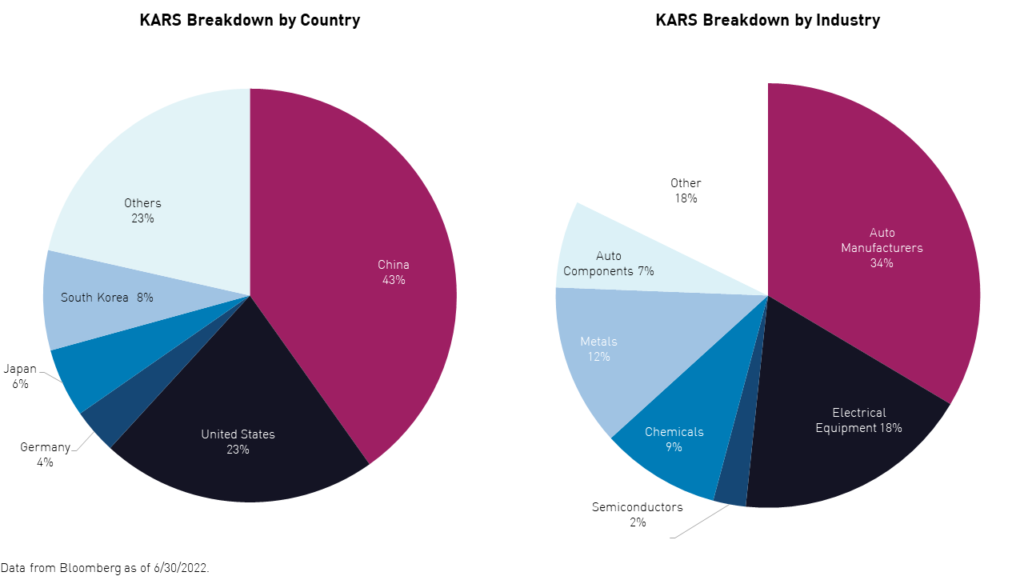
The KraneShares Electric Vehicles & Future Mobility ESG Screened UCITS ETF (Ticker: KARS) provides exposure to the world's largest EV markets: China, Europe, and the US. KARS also offers comprehensive exposure to the entire electric vehicle ecosystem, which includes EV manufacturers, battery companies, vehicle connectivity providers, autonomous capability providers, charging infrastructure, and raw materials.
The Fund includes companies that have favorable thematic rankings from BNEF due to significant revenue exposure to the EV transition. KARS also offers a low overlap with traditional global indexes.
Conclusion
We believe the electric vehicle opportunity looks attractive not only due to the long-term secular trend of growing adoption but also because it could be a solution to slowing global growth. While the auto industry tends to be cyclical and impacted by slowdowns, we expect the electric vehicle segment to continue to exhibit long-term growth. The EV share may continue to grow at the expense of ICE vehicles, driven by favorable government policies, innovation, and strong consumer adoption, making the investment opportunity less susceptible to the whims of global macroeconomics and an effective source of growth.
This is a marketing communication. Please refer to the UCITS and to the KIID before making any final investment decision.
KARS seeks to promote a combination of environmental and social characteristics, within the meaning of Article 8. Investors should refer to the “Sustainable Finance” section of the Prospectus for further details on how the Investment Manager addresses Sustainability Risk and ESG Integration for KARS. In line with the Index methodology, KARS promotes environmental characteristics but does not commit to making environmentally sustainable investments as defined in the Taxonomy Regulation.
The views and opinions expressed in this material are those of the authors Krane Fund Advisors. These opinions have been given in good faith, but are subject to change without notice. It is the responsibility of the investor to evaluate the accuracy, completeness, and usefulness of any opinions, advice, services, or other information provided.
Citations:
- Data from LMC Automotive & Bloomberg New Energy Finance (BNEF) as of 6/30/2022.
- Data from HSBC as of 6/30/2022.
Please click here for KARS Top 10 Holdings
Index & Term Definitions:
Upside Capture: Upside capture is the statistical measurement of an investment manager's overall performance in an up market. It measures that manager's or security's ability to capture moves higher in the market overall.
Downside Capture: Downside capture is the statistical measurement of an investment manager's overall performance in a down market. It measures that manager's or security's ability to avoid moves lower in the market overall.
S&P 500 Index: The S&P 500 Index is widely regarded as the best single gauge of large-cap U.S. equities. There is over USD 9.9 trillion indexed or benchmarked to the index, with indexed assets comprising approximately USD 3.4 trillion of this total. The index includes 500 leading companies and covers approximately 80% of available market capitalization. The index was launched on March 4, 1957.
Bloomberg Electric Vehicles Index (BBEVT): The Bloomberg Electric Vehicles Index is designed to track the performance of companies engaged in the production of electric vehicles and/or their components, or engaged in other initiatives that may change the future of mobility. The index was launched on June 2, 2021.
Solactive Autonomous & Electric Vehicles Index: The Solactive Autonomous & Electric Vehicles Index tracks the price movements in shares of companies that are (or are expected to be in the near future) active in the electric vehicles and autonomous driving segments. This particularly includes electric vehicle manufacturers, electric vehicle component producers, companies that mine or produce raw materials that are relevant to the electric vehicle and autonomous vehicle technology segment, companies that build autonomous vehicles, and suppliers of autonomous vehicle technologies. The index was launched on March 14, 2018.
Nasdaq Yewno Global Future Mobility Index: The Nasdaq Yewno Global Future Mobility Index is designed to track the performance of companies engaged in the following themes: Autonomous Vehicles, Quantum Information & Optics, 3D Graphics, Electric Vehicles, Hybrid Vehicles, Electric Batteries, and Lithium Batteries. The index was launched on November 12, 2018.
STOXX Global EV & Driving Technology Index: The STOXX Global Electric Vehicles & Driving Technology Index is comprised of companies from selected countries exposed to a defined theme: electric vehicles and assisted-driving technologies. The index was launched on October 24, 2018.
Alpha: Alpha is a term used to describe an investment strategy's ability to beat the market or its "edge." It is also referred to as excess return. Alpha indicates the degree to which a given security or investment strategy outperforms the broader market.
Beta: Beta is a measure of the volatility or systematic risk of a security or portfolio compared to the market as a whole. Stocks with betas higher than 1 can be interpreted as more volatile than the S&P 500. Betas tend to be use to determine the extent to which a security moves in tandem with the broader market.
Megawatt Hours (MWh): A megawatt-hour (MWh) equals 1,000 kilowatts of electricity generated per hour and is used to measure electric output. In general, megawatts are used to calculate how much a power plant generates electricity or how much electricity is consumed by a particular area, such as a city, state, or country.
MSCI ACWI: The MSCI All Country World Index (ACWI) captures large and mid cap representation across 23 Developed Markets (DM) and 27 Emerging Markets (EM) countries*. With 2,978 constituents, the index covers approximately 85% of the global investable equity opportunity set. The index was launched on January 1, 2001.