

Perception Versus Reality on Trade and China’s Economy

Positive developments around the G20 meeting have inspired renewed optimism, but trade concerns still linger for many global investors. Last month’s trade negotiation roadblock caused broad Chinese equities to drop 11.64% in May as represented by MSCI China All Shares Index1. We believe this performance was driven in part by headlines that emphasized manufacturing and exports in China, ignoring the country’s thriving domestic market and over a decade-long shift to a services-driven economy. When looking at the current composition of China's economy, we see plenty of growth regardless of the course of negotiations.
For many years China was the factory of the world. Despite this not necessarily being true anymore, the idea is consistently reinforced in headlines such as:
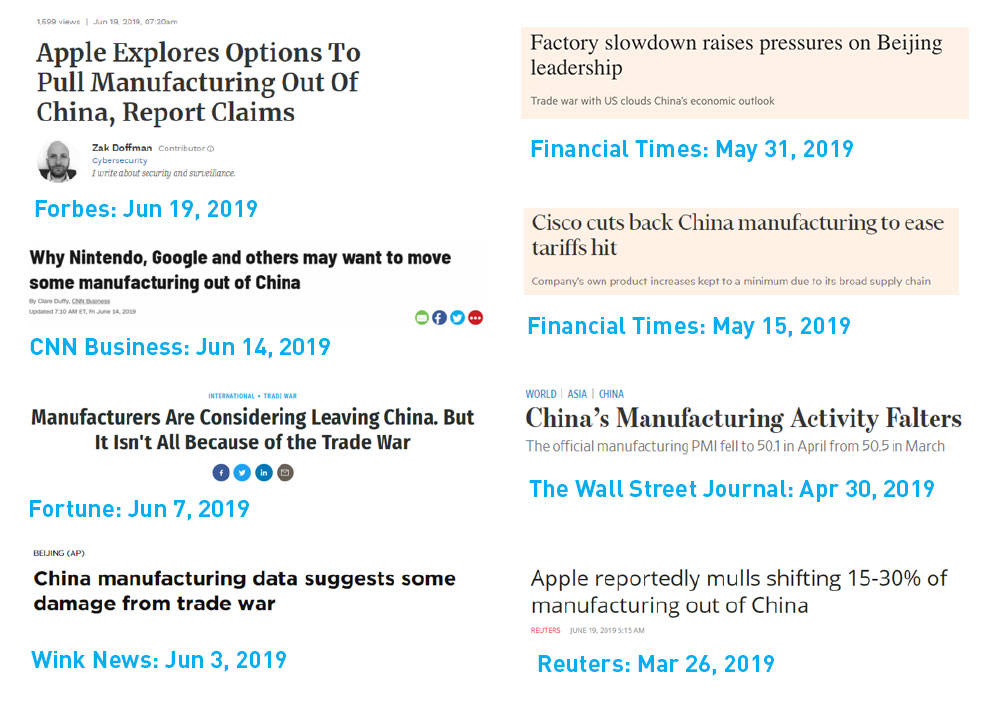
While it is true that manufacturing is slowing, these headlines do not reflect the Chinese economy's new direction and growth of its services sector.
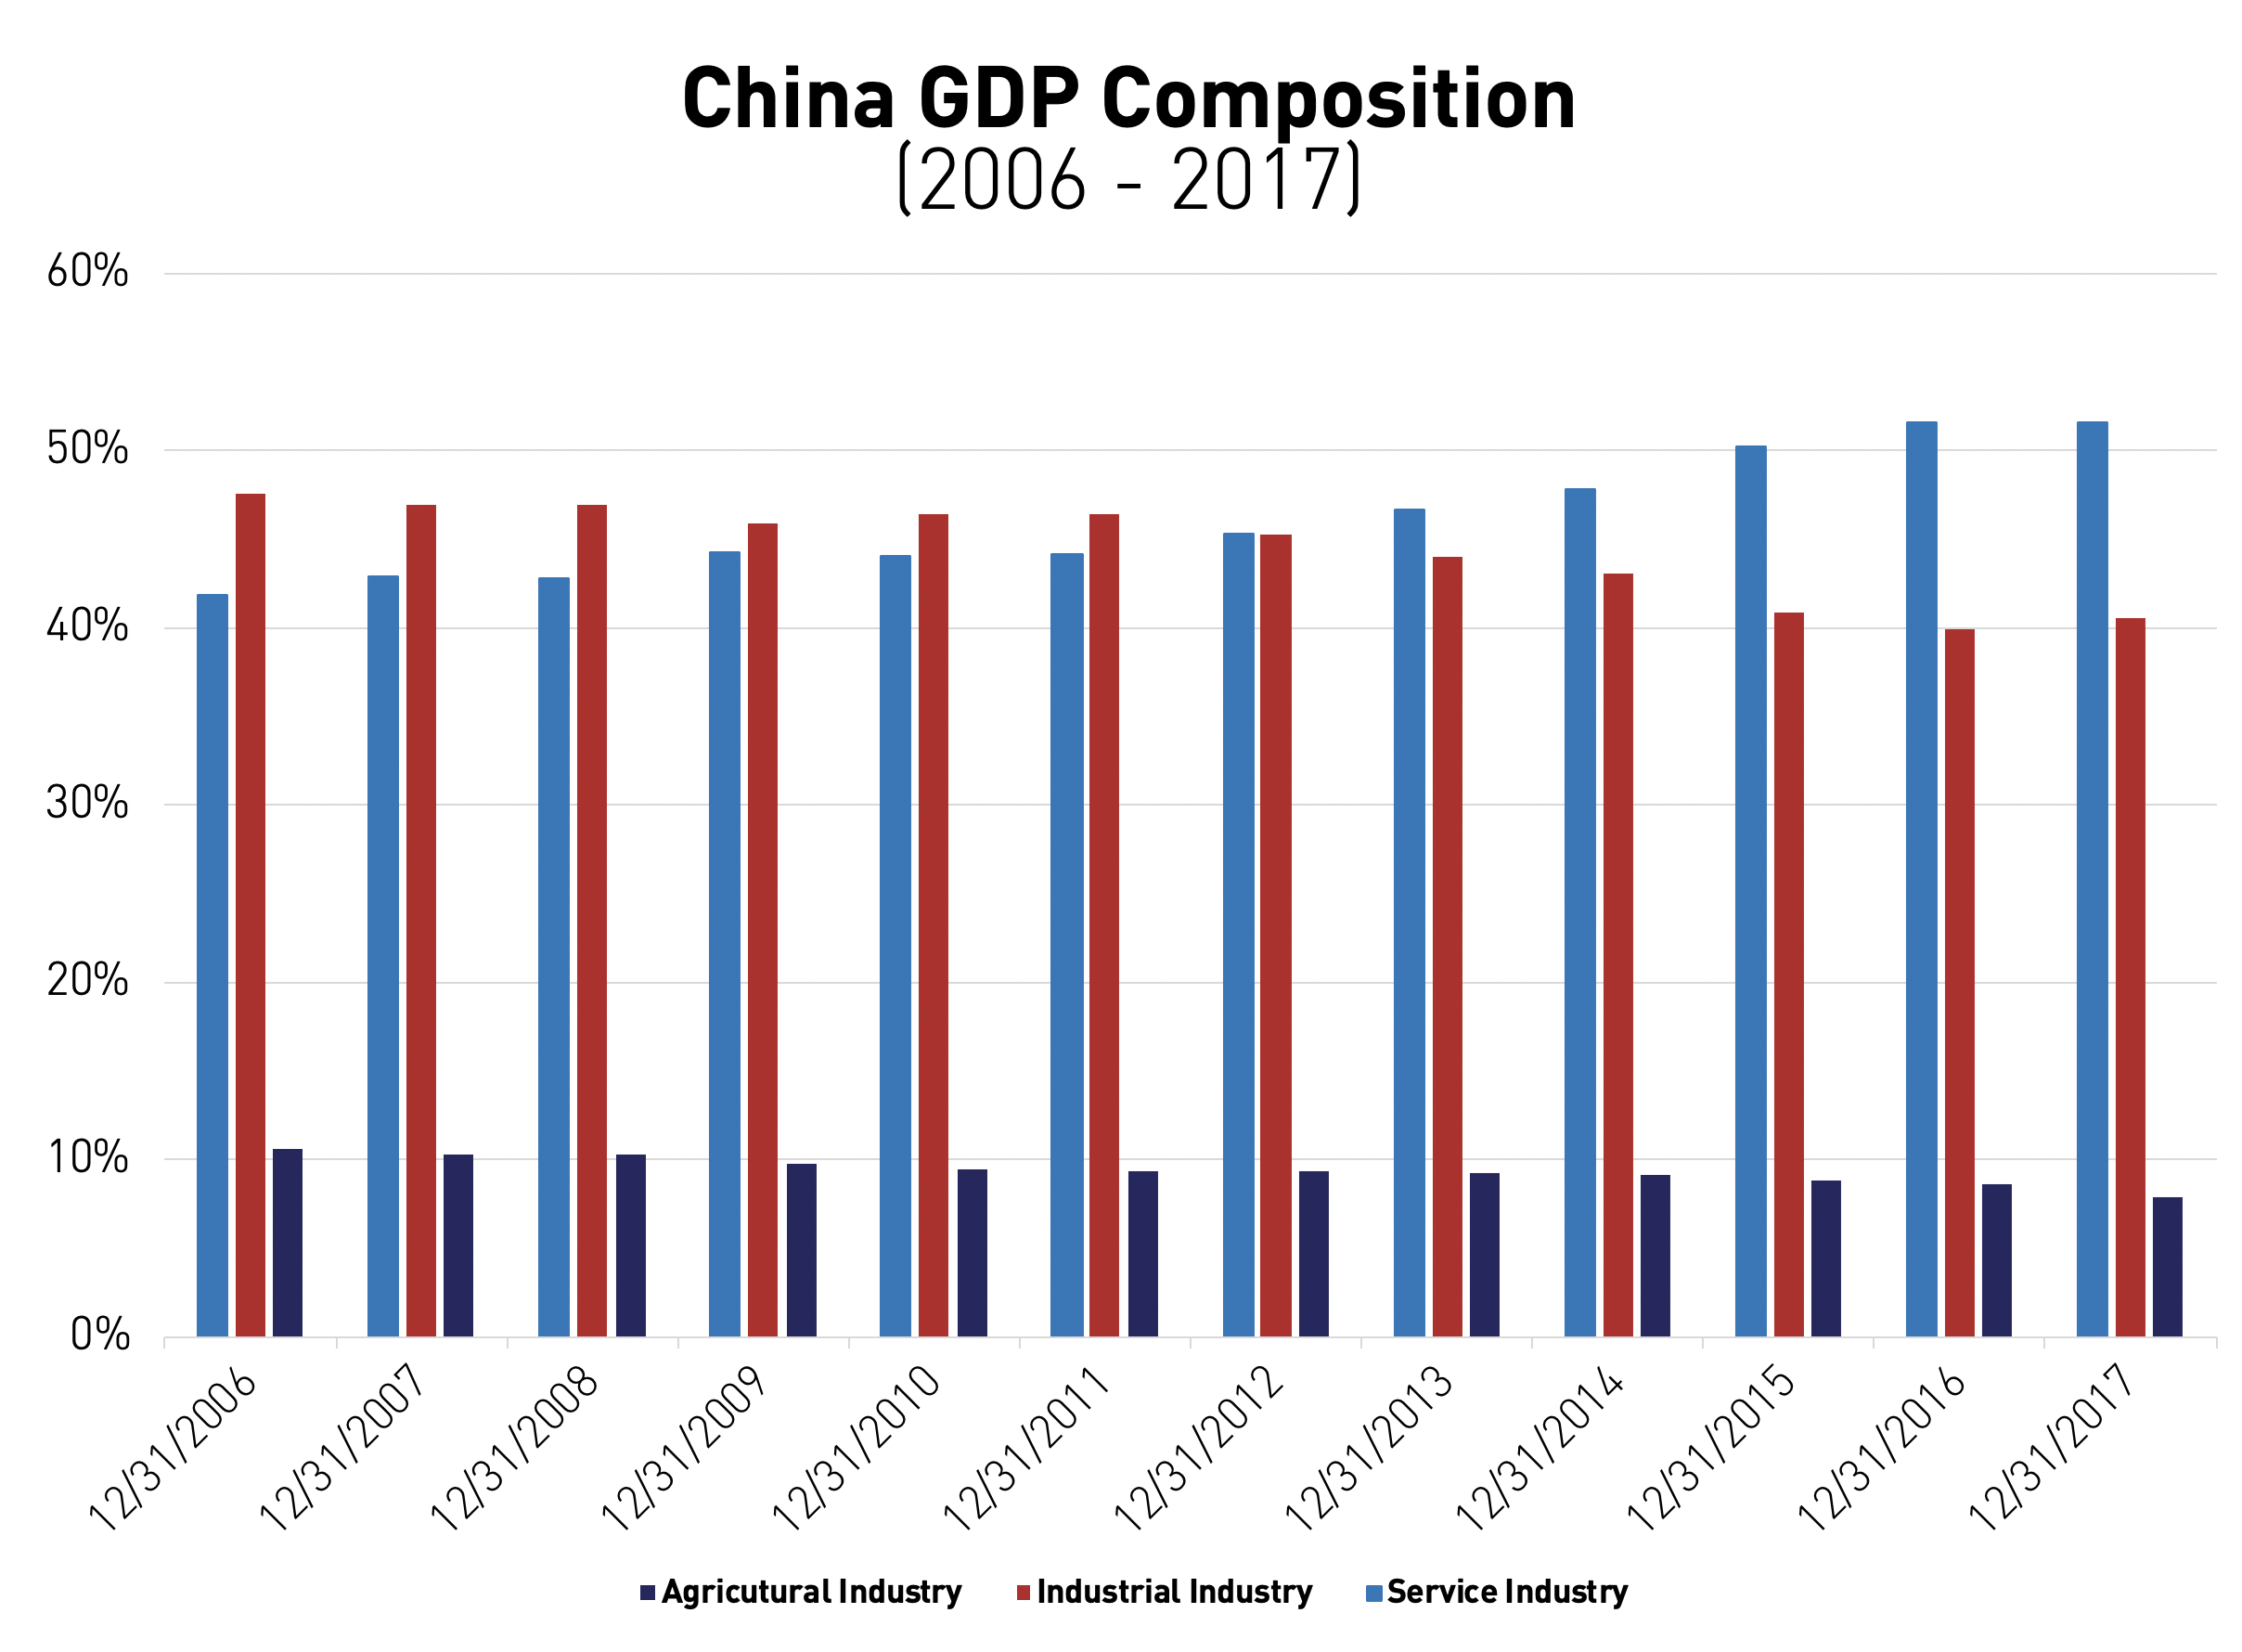
China’s economy is in a different place today than it was a decade ago. Today services have surpassed manufacturing as the largest contributor to China’s economy, representing over 50% of GDP2, while manufacturing only represents 40%3.
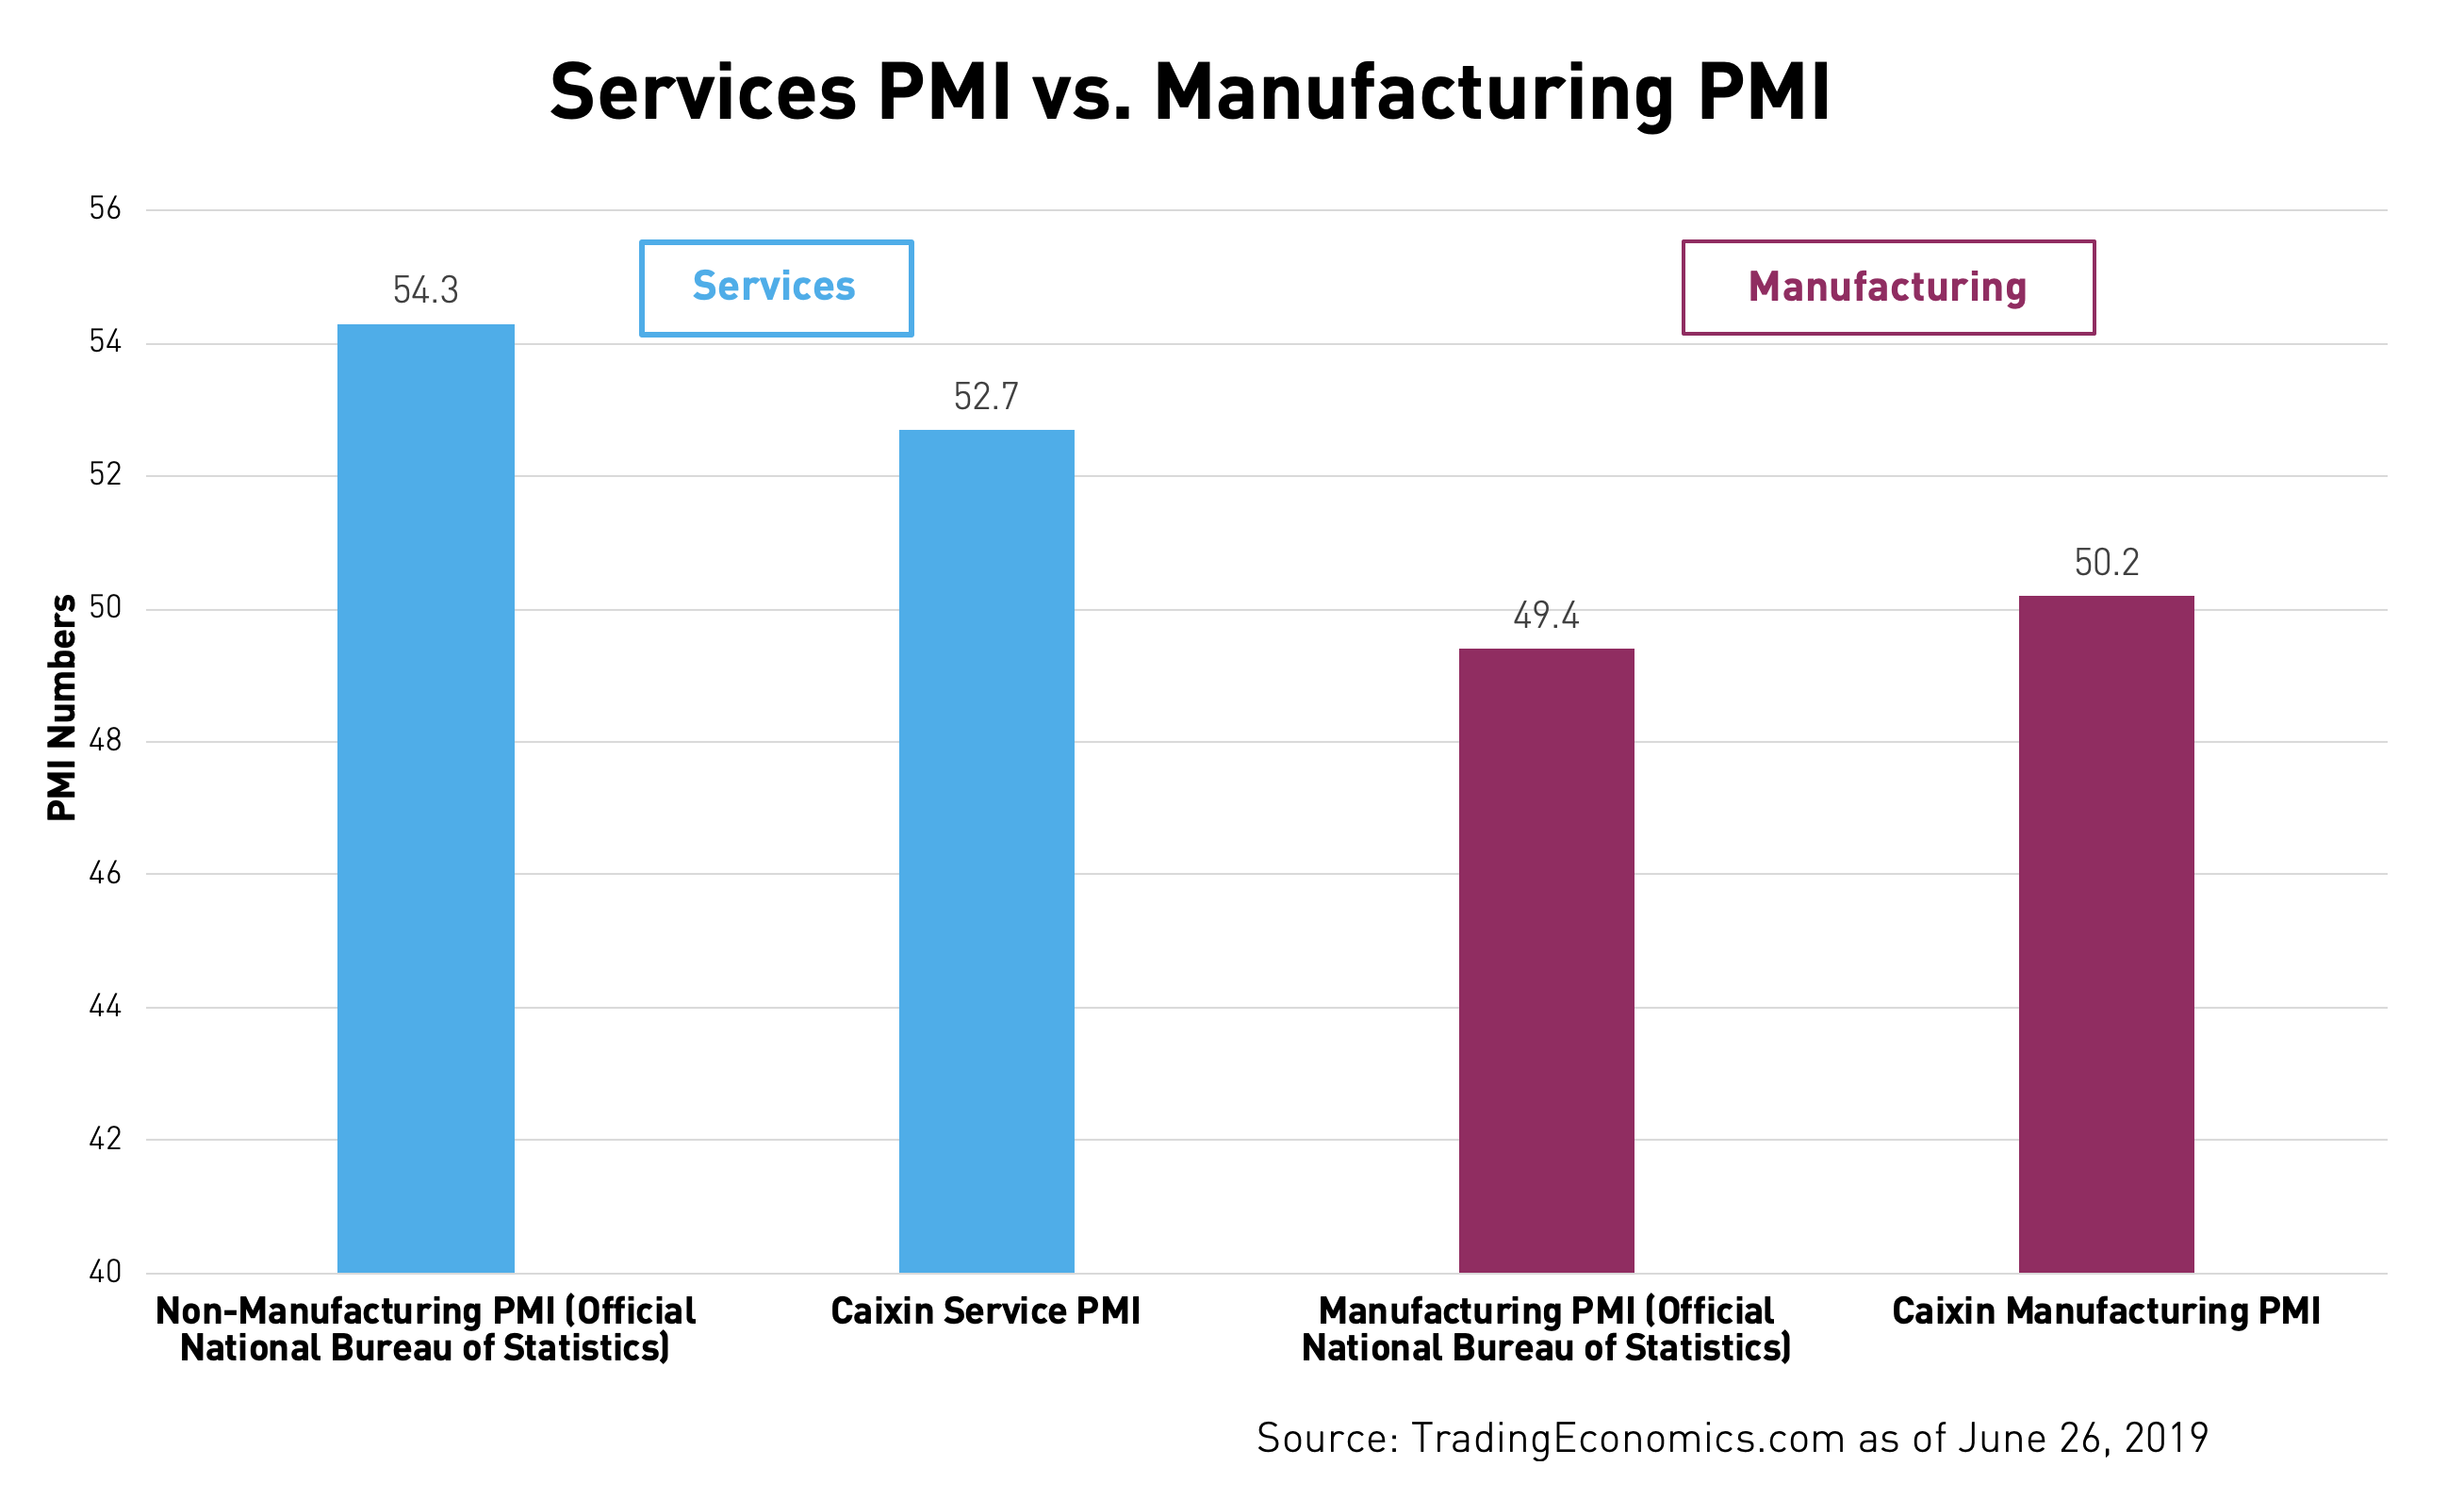
A helpful gauge to understand the health of China’s services sector is the Non-Manufacturing Purchasing Managers Index (PMI) which measures the prevailing direction of economic trends in the service sectors based on a monthly survey of senior purchasing executives. Index levels above 50 indicate expansion and under 50 indicate contraction. In May, China’s official Non-Manufacturing PMI was 54.34, indicating that the services sector in China is expanding. Looking beyond the official government numbers, the Caixin Services PMI, conducted in conjunction with US-listed IHS Markit, reported China’s Services PMI was 52.75. Official retail sales numbers in China also grew for the month of May, up 8.4% year-over-year; US retail sales only grew 0.2% over the same period. However, these positive numbers were overshadowed by the Manufacturing PMI, which dipped below 50 in May6, generating negative headlines like those shown above.
While segments of China’s economy have been adversely affected by the trade war, exports are a smaller part of China’s GDP than they are frequently portrayed. In reality, exports are less than 20% of China’s total GDP7 and exports to the US are only 4% of China’s total GDP8.
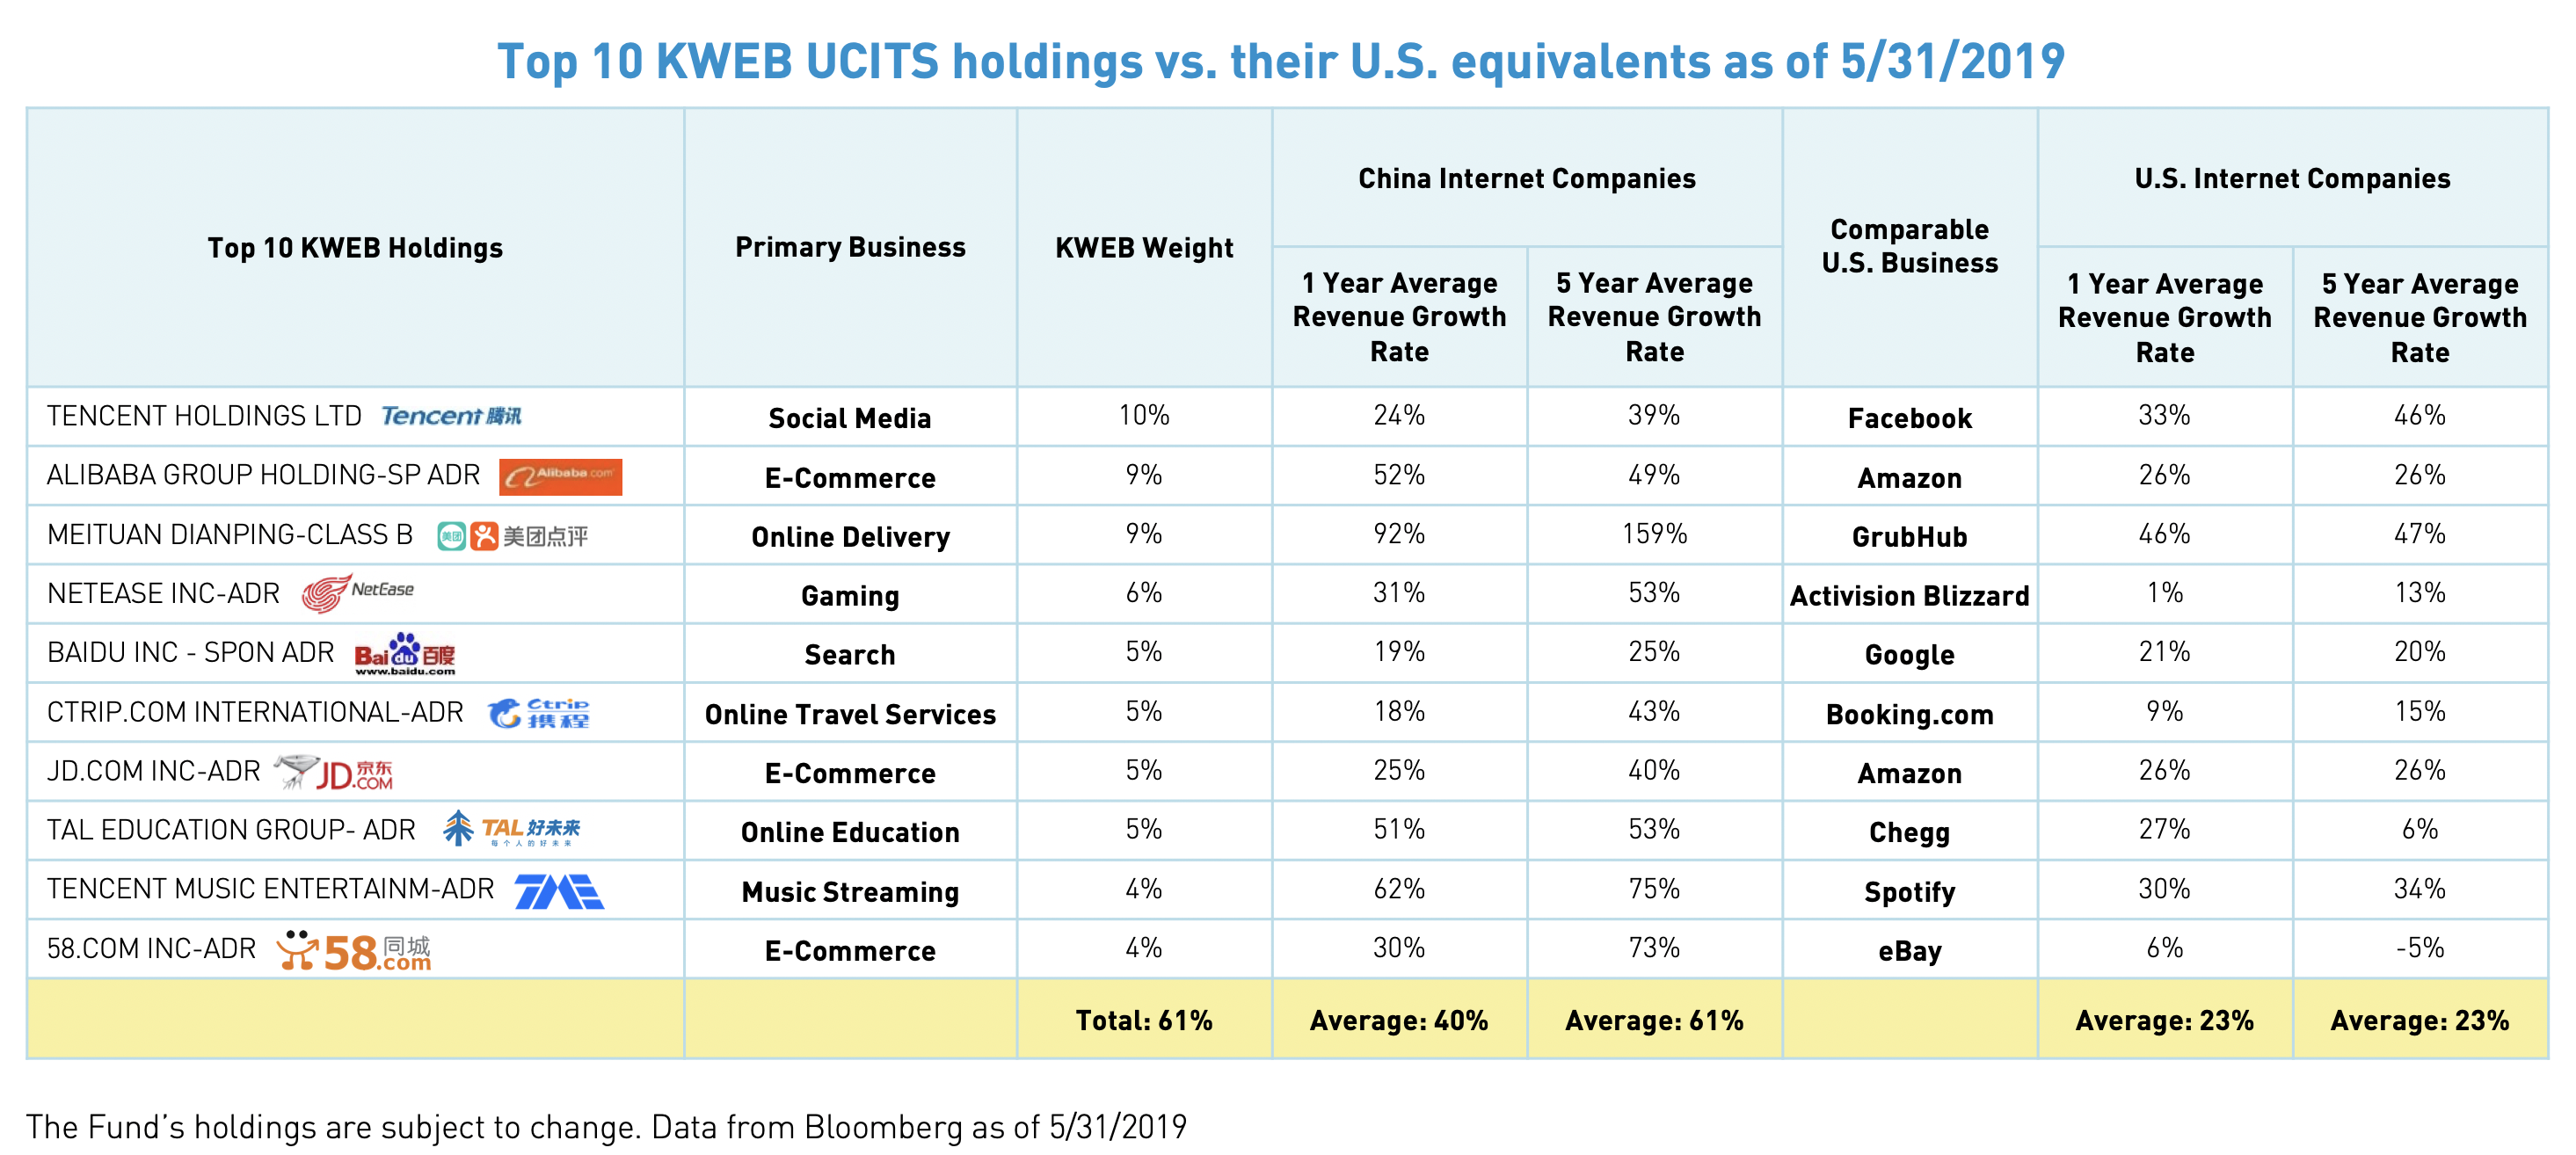
Like China’s economy at large, which has become increasingly self-sufficient, the companies held within KraneShares’ suite of ETFs generate the majority of their revenue from the domestic Chinese market. For example, the KraneShares CSI China Internet UCITS ETF (ticker: KWEB), derives less than 5% of revenue from outside China9, much of which comes from neighboring Asian countries. Internet-based companies such as Tencent, Alibaba, Baidu, Ctrip, and Weibo are all focused on the Chinese domestic market and have limited exposure to global trade policy. These companies have continued to grow revenue at a much faster rate than their US equivalents with 1 and 5-year revenue growth rates for the top 10 holdings within KWEB averaging 40% and 61% respectively compared to 1 and 5-year growth rates of 23% for their US counterparts.
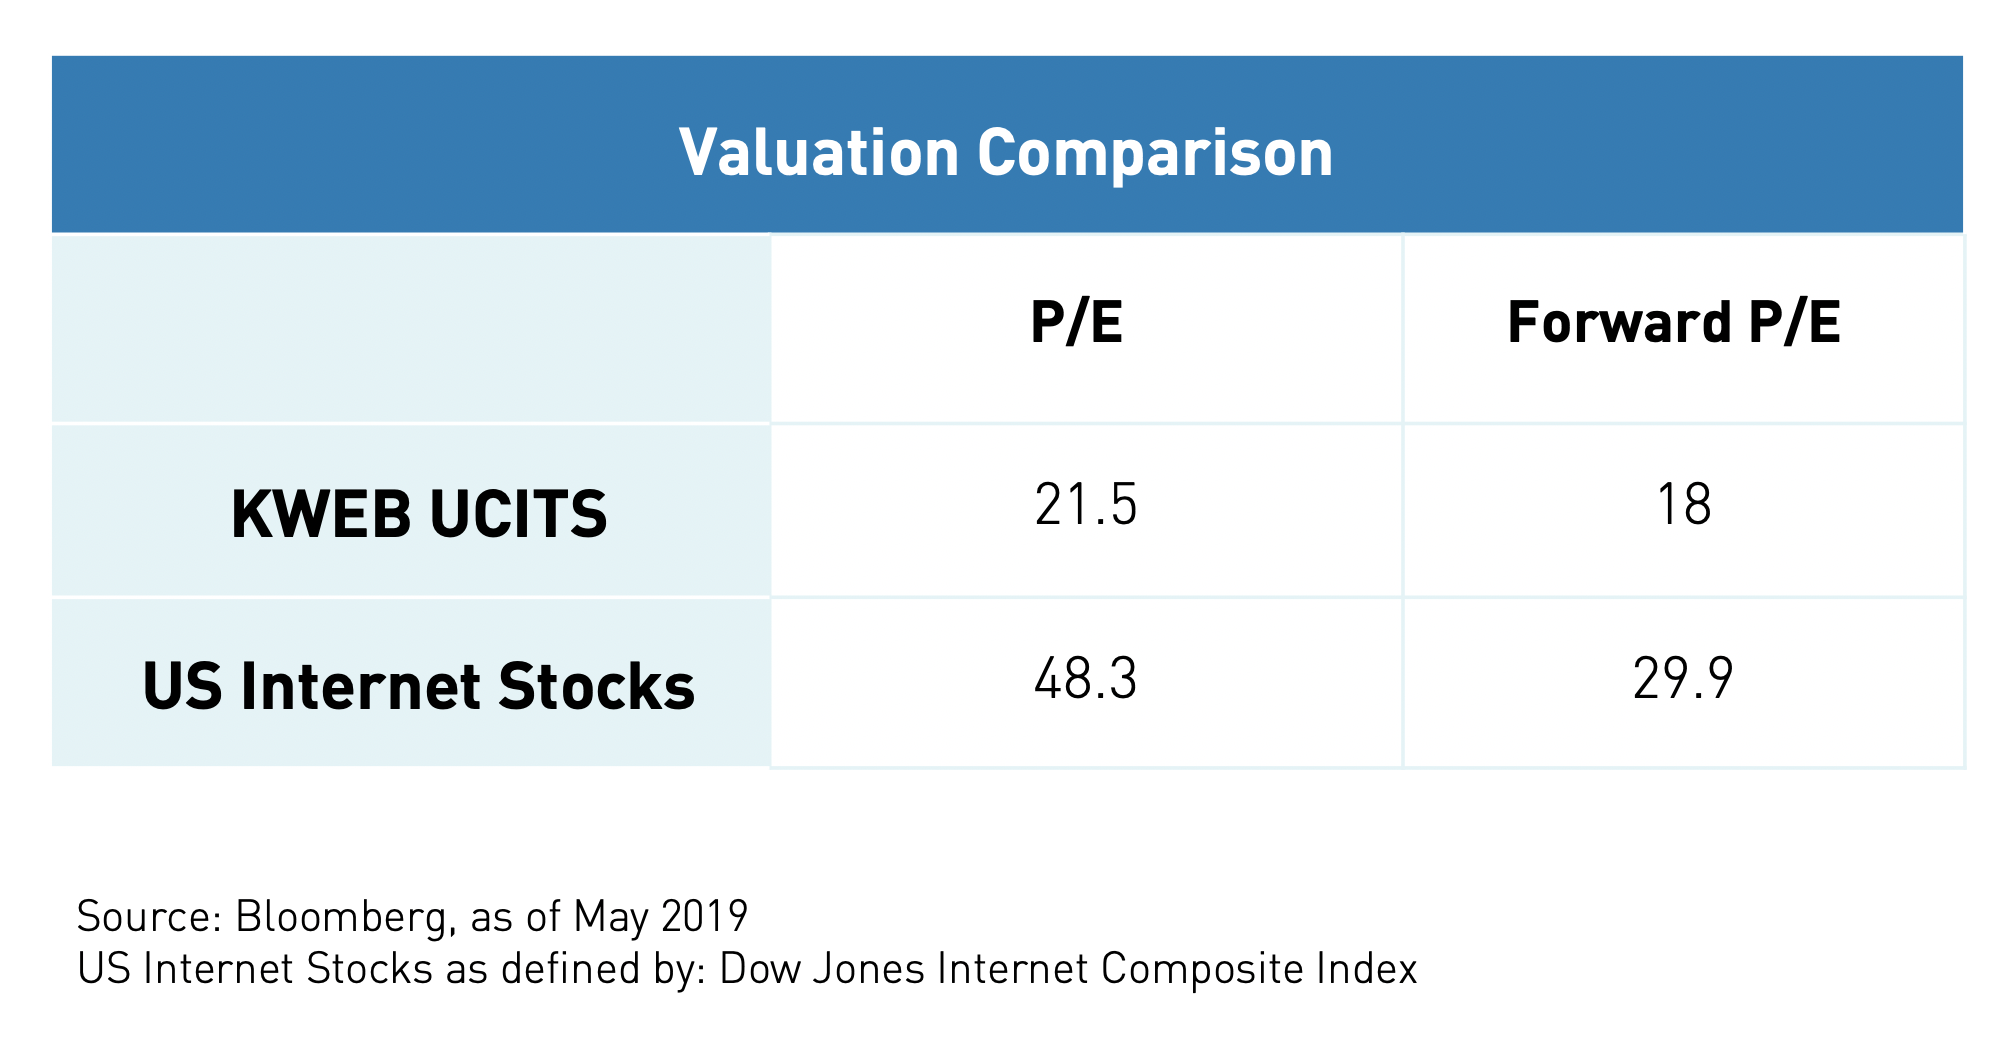
At the same time valuations for Chinese internet companies are attractive compared to their US peers. Currently, KWEB’s P/E is 21.5 and forward P/E is 18.
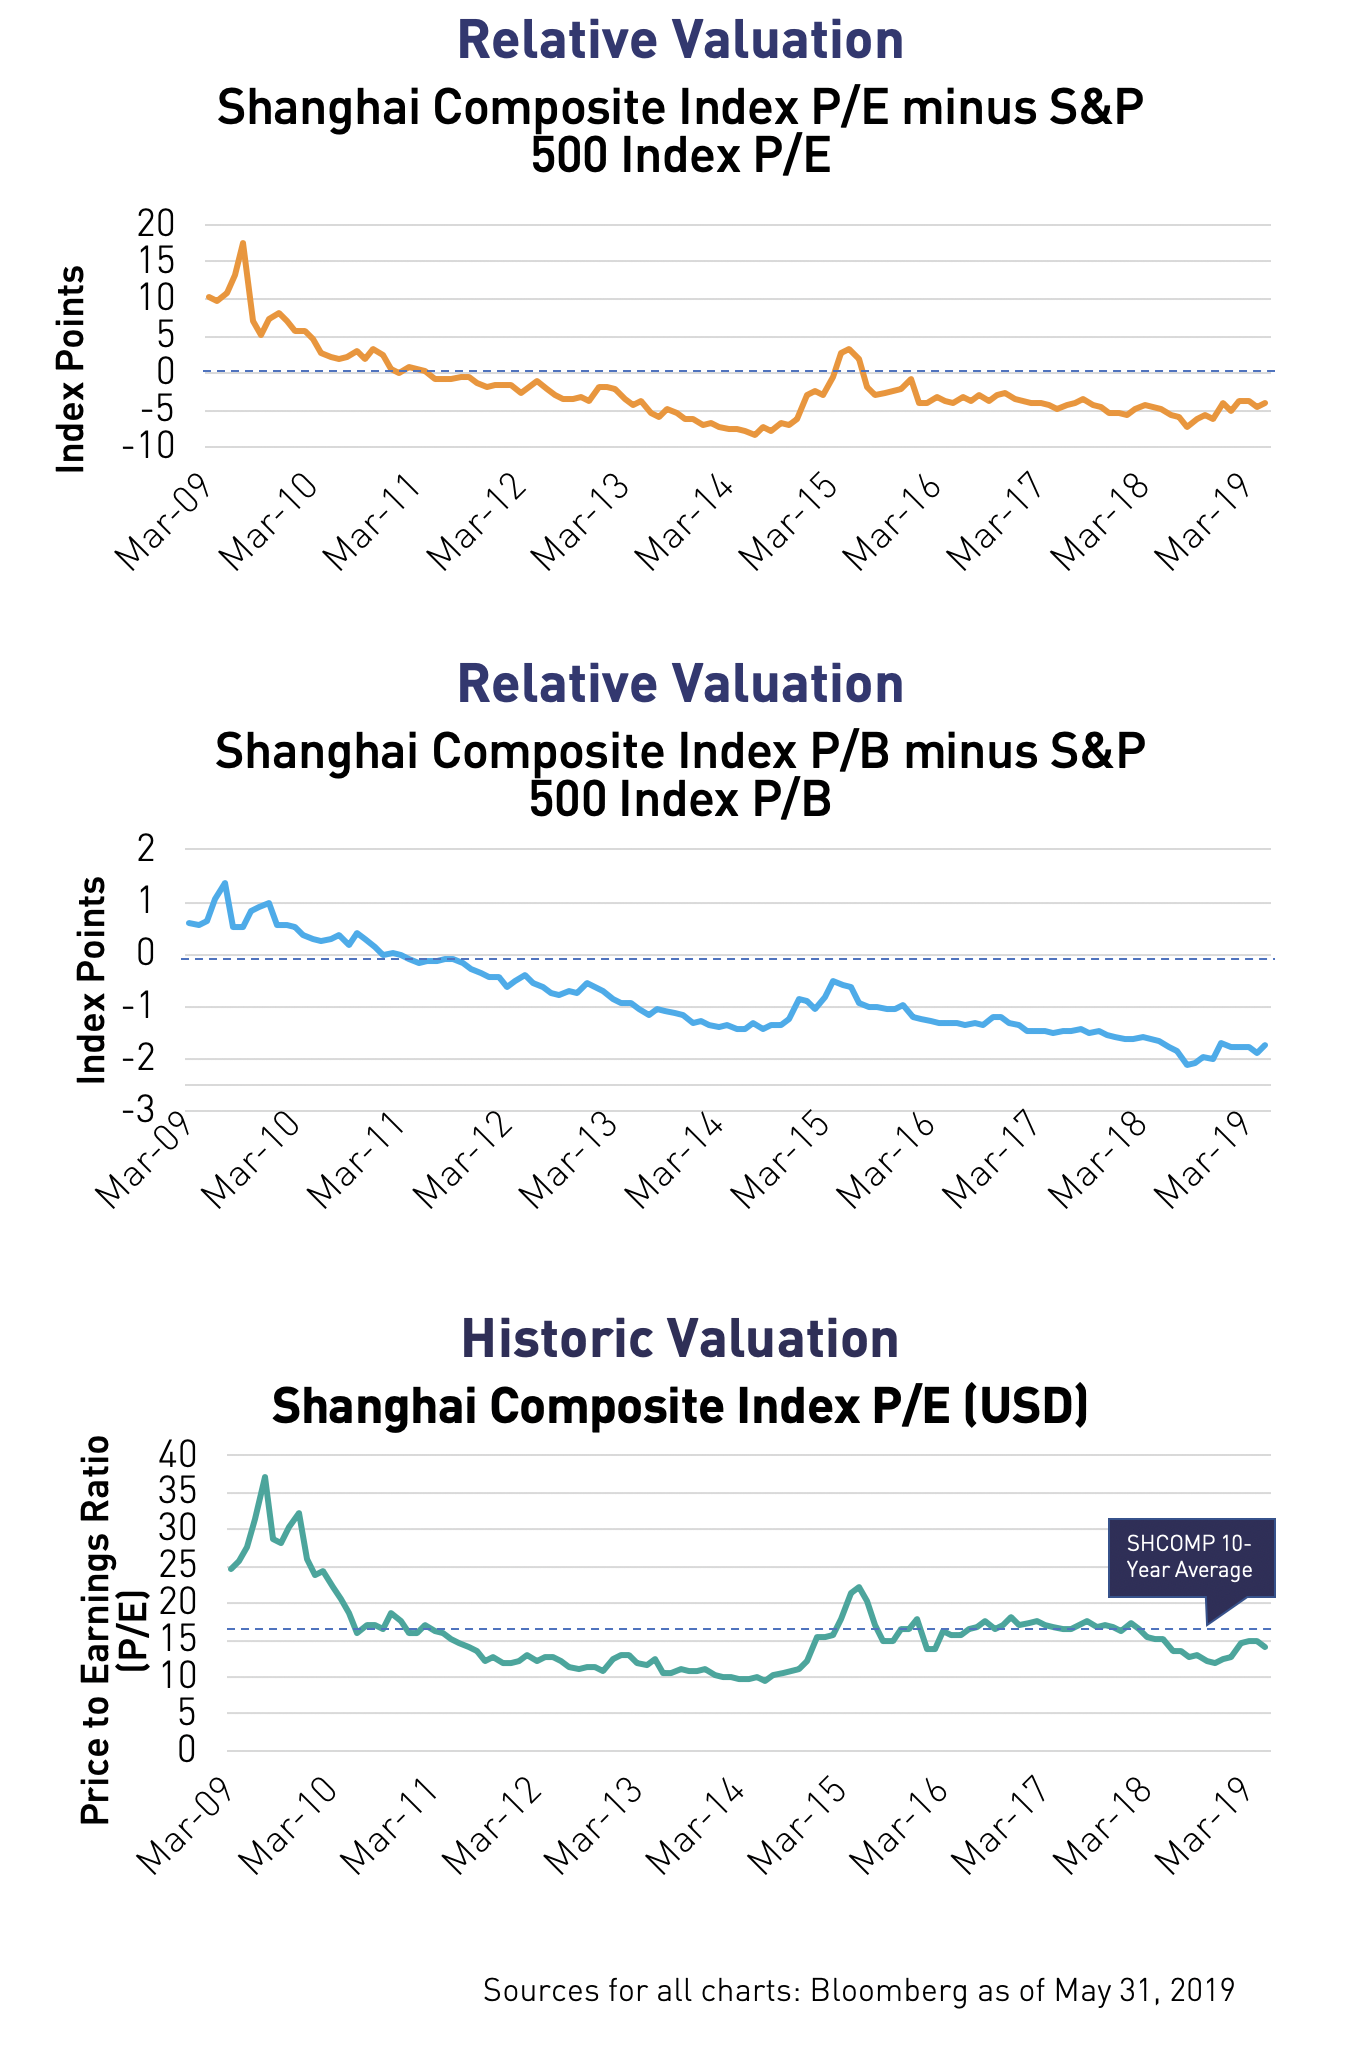
Additionally, the KraneShares Bosera MSCI China A Share UCITS ETF (ticker: KBA), also derives the majority of its revenue from China, with less than 9% of revenue coming from abroad10. Ironically, as China and the US appear to be moving further apart on trade, their capital markets have never been more interconnected. This interconnection is driven by Mainland listed Chinese stocks (A-Shares) inclusion into broad international indexes. Global index provider MSCI’s inclusion of A-shares into their Global Standard Indexes are projected to trigger over $300 billion to be reallocated into securities tracked by the MSCI China A index, KBA’s benchmark. Additionally, on June 24th, global index provider FTSE Russell added a 5.5% weighting of A-Shares into their Emerging Markets Index, tracked by $140 billion in assets11. Comparing China’s Mainland Market, as measured by the Shanghai Composite Index, to the S&P 500 we see valuations are low even with these foreign inflows.
China has undergone a massive shift in recent years which has transformed its economy. While trade tension fueled volatility can be discouraging, we believe investors who are interested in China may potentially benefit from taking a long-term view looking beyond the headlines. Focusing too much on the exports and manufacturing that defined China’s old economy can detract from real opportunities occurring right now in China’s services sector and domestic market.
- Bloomberg as of June 21, 2019
- Bloomberg as of June 21, 2019
- Bloomberg as of June 21, 2019
- National Bureau of Statistics of China, as of June 21, 2019
- Trading Economics as of June 26, 2019
- Trading Economics as of June 26, 2019
- Bloomberg as of June 21, 2019
- World Bank Data as of June 21, 2019
- Bloomberg as of May 31, 2019
- Bloomberg as of May 31, 2019
- Forbes "What Trade War? FTSE Adds Mainland China Stocks To $140 Billion Index", as of June 26, 2019
Weights of KWEB Holding Mentioned:
- Tecent % of KWEB net assets as of 6/26/2019: 10.19%.
- Alibaba % of KWEB net assets as of 6/26/2019: 9.03%.
- Baidu % of KWEB net assets as of 6/26/2019: 8.06%.
- Ctrip % of KWEB net assets as of 6/26/2019: 4.18%.
- Weibo % of KWEB net assets as of 6/26/2019: 1.65%.
Top 10 holdings for KBA can be found here.
Index Definitions:
- MSCI China All Shares Index: The MSCI China All Shares Index captures large and mid-cap representation across China A‐shares, B‐shares, H‐shares, Red‐chips, P‐chips and foreign listings (e.g. ADRs).
- MSCI China A Index: Captures large and mid-cap representation across China securities listed on the Shanghai and Shenzhen exchanges. The index covers only those securities that are accessible through "Stock Connect". The index is designed for international investors and is calculated using China A Stock Connect listings based on the offshore RMB exchange rate (CNH).
- FTSE Emerging Index: FTSE Emerging Markets indices are part of the FTSE Global Equity Index Series (GEIS). The series includes large and mid cap securities from advanced and secondary emerging markets, classified in accordance with FTSE's transparent Country Classification Review Process.
- The Shanghai Stock Exchange Composite Index: The Shanghai Stock Exchange Composite Index is a capitalization-weighted index. The index tracks the daily price performance of all A-shares and B-shares listed on the Shanghai Stock Exchange.
- The S&P 500 Index: The S&P 500 index tracks the stocks of 500 large-cap U.S. companies.R_DMS